Open Access
Fig. 13.
Download original image
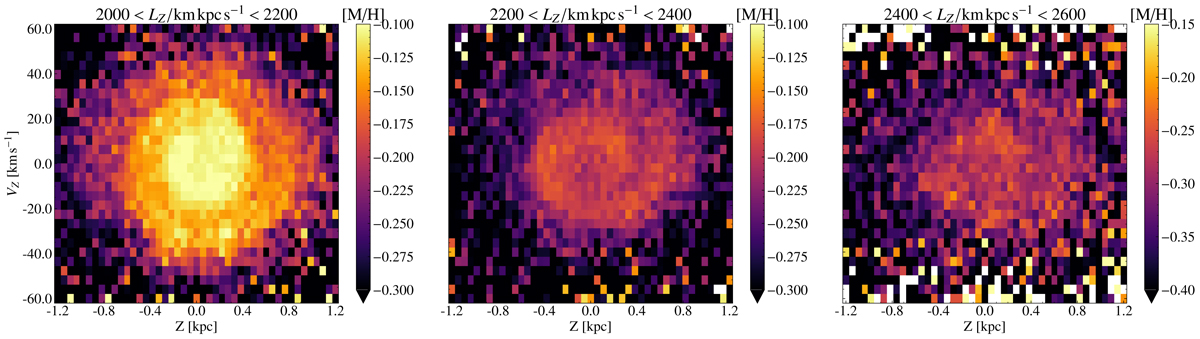
Phase spirals coloured by mean global metallicity at low, medium, and high angular momentum, showing that the spiral pattern is visible. These can be compared to Fig. 11. We note that the rightmost panel has different values on the colour bar. The data are split into the three angular momentum ranges marked in Fig. 3.
Current usage metrics show cumulative count of Article Views (full-text article views including HTML views, PDF and ePub downloads, according to the available data) and Abstracts Views on Vision4Press platform.
Data correspond to usage on the plateform after 2015. The current usage metrics is available 48-96 hours after online publication and is updated daily on week days.
Initial download of the metrics may take a while.