Fig. 11.
Download original image
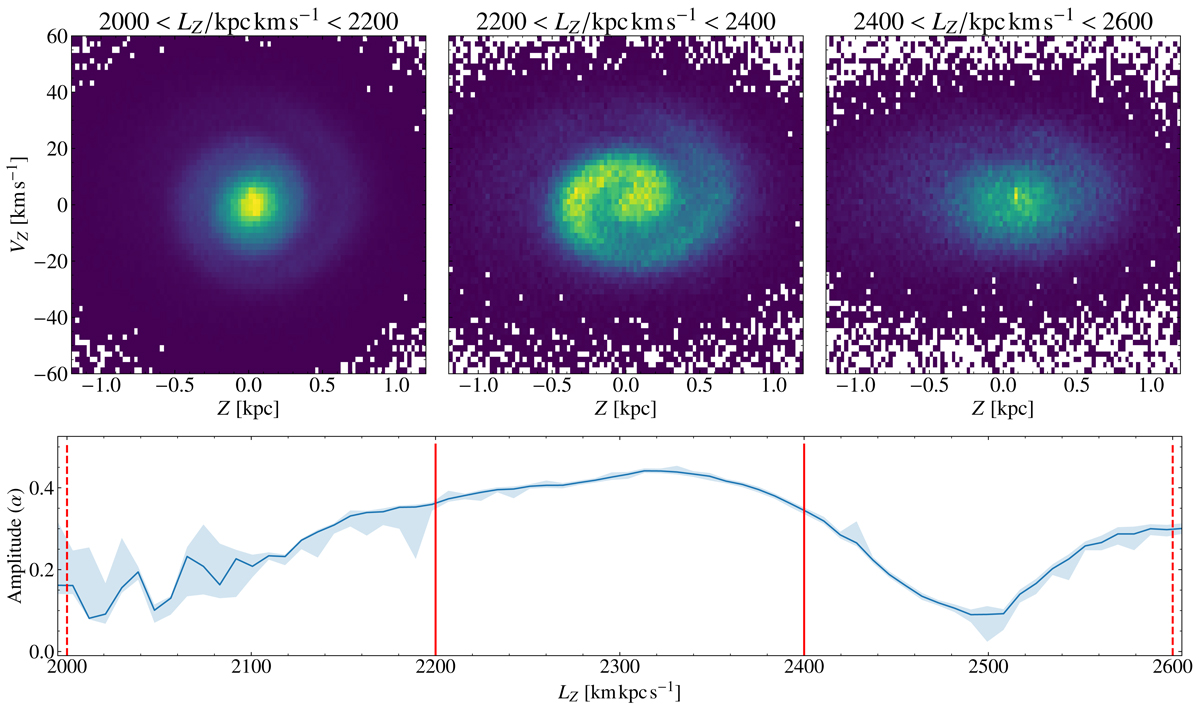
Measurements of the amplitude of the phase spiral as a function of angular momentum. Top: number density of stars at low, medium, and high angular momentum, showing the phase spiral change shape and amplitude. Bottom: amplitude of the phase-spiral pattern as a function of angular momentum. The lines are the same as in Fig. 3. The sample only includes stars that are within 500 pc radially of where a star with the same angular momentum on a circular orbit would be and have a galactocentric radial velocity of less than 22.5 km s−1 in order to restrict the selection to stars on cold orbits. The shaded area shows the 84th and 16th percentiles.
Current usage metrics show cumulative count of Article Views (full-text article views including HTML views, PDF and ePub downloads, according to the available data) and Abstracts Views on Vision4Press platform.
Data correspond to usage on the plateform after 2015. The current usage metrics is available 48-96 hours after online publication and is updated daily on week days.
Initial download of the metrics may take a while.