Open Access
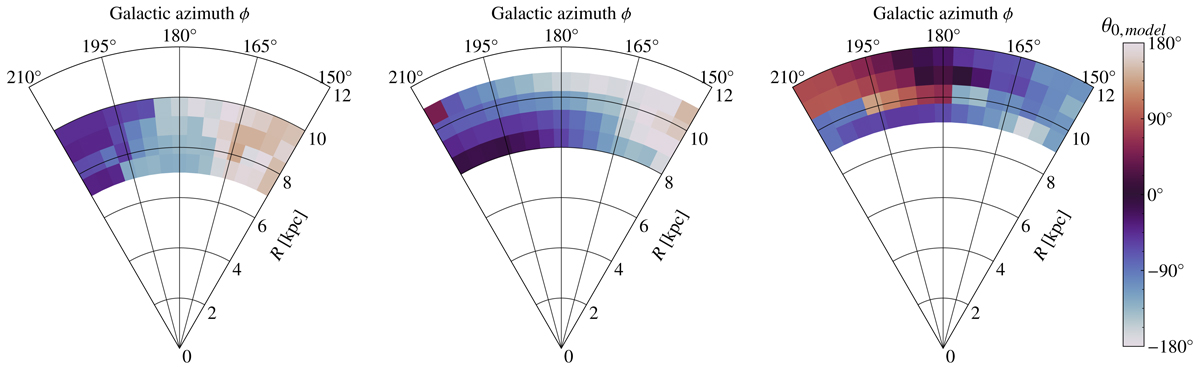
Fig. 10.
Download original image
Angle (θ 0, model) of the phase spiral as measured by the model, showing the rotation across the Galactic disc. The plots show data for different regions of the Galaxy as seen from above for the three angular momentum ranges marked in Fig. 3. The colour bar is periodic and the zero point is arbitrary.
Current usage metrics show cumulative count of Article Views (full-text article views including HTML views, PDF and ePub downloads, according to the available data) and Abstracts Views on Vision4Press platform.
Data correspond to usage on the plateform after 2015. The current usage metrics is available 48-96 hours after online publication and is updated daily on week days.
Initial download of the metrics may take a while.