Open Access
Fig. 7.
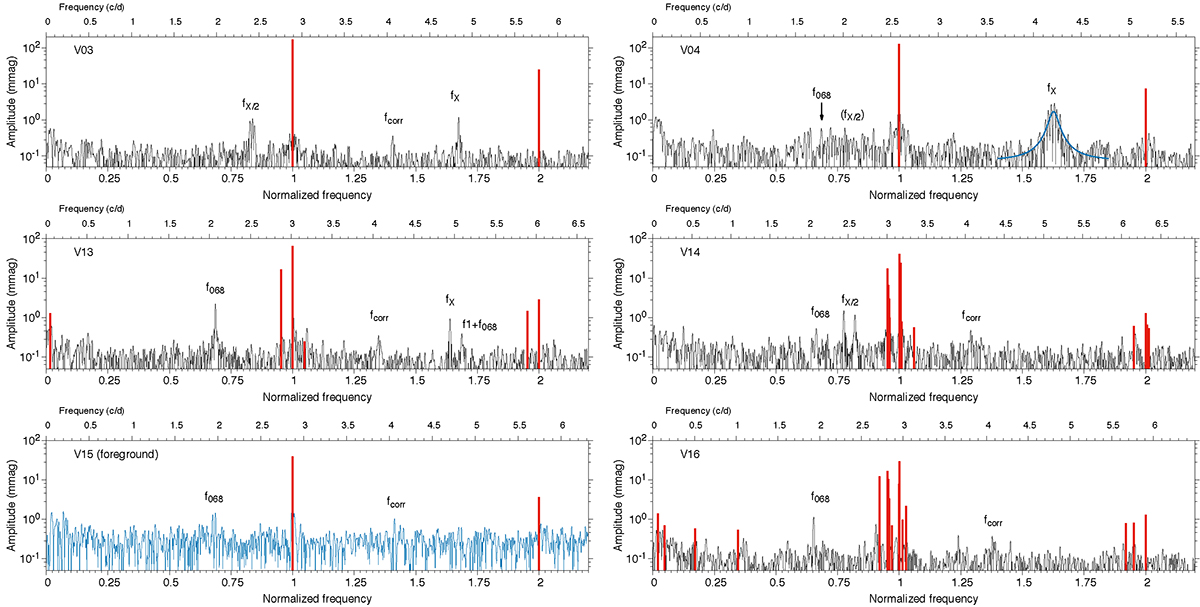
Download original image
Fourier spectra of the RRc stars that exhibit extra modes. Red bars mark frequencies that have been prewhitened. The blue line in V04 shows the Lorentzian fit to the fX mode.
Current usage metrics show cumulative count of Article Views (full-text article views including HTML views, PDF and ePub downloads, according to the available data) and Abstracts Views on Vision4Press platform.
Data correspond to usage on the plateform after 2015. The current usage metrics is available 48-96 hours after online publication and is updated daily on week days.
Initial download of the metrics may take a while.