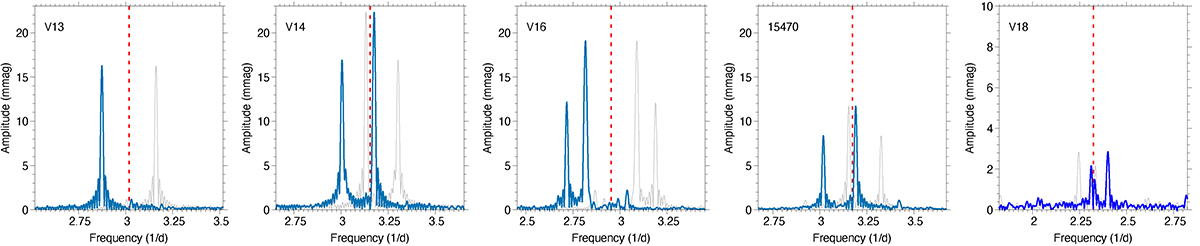
Fig. 6.
Download original image
Side-peak structures around the main pulsation frequency (red dashed line), which has been already pre-whitened. The blue line is the residual frequency spectrum, the gray line is the same, but mirrored in frequency around the pulsation peak. Note: the lack of overlap among the side-peaks and the change in amplitude scale for V18 (dark blue).
Current usage metrics show cumulative count of Article Views (full-text article views including HTML views, PDF and ePub downloads, according to the available data) and Abstracts Views on Vision4Press platform.
Data correspond to usage on the plateform after 2015. The current usage metrics is available 48-96 hours after online publication and is updated daily on week days.
Initial download of the metrics may take a while.