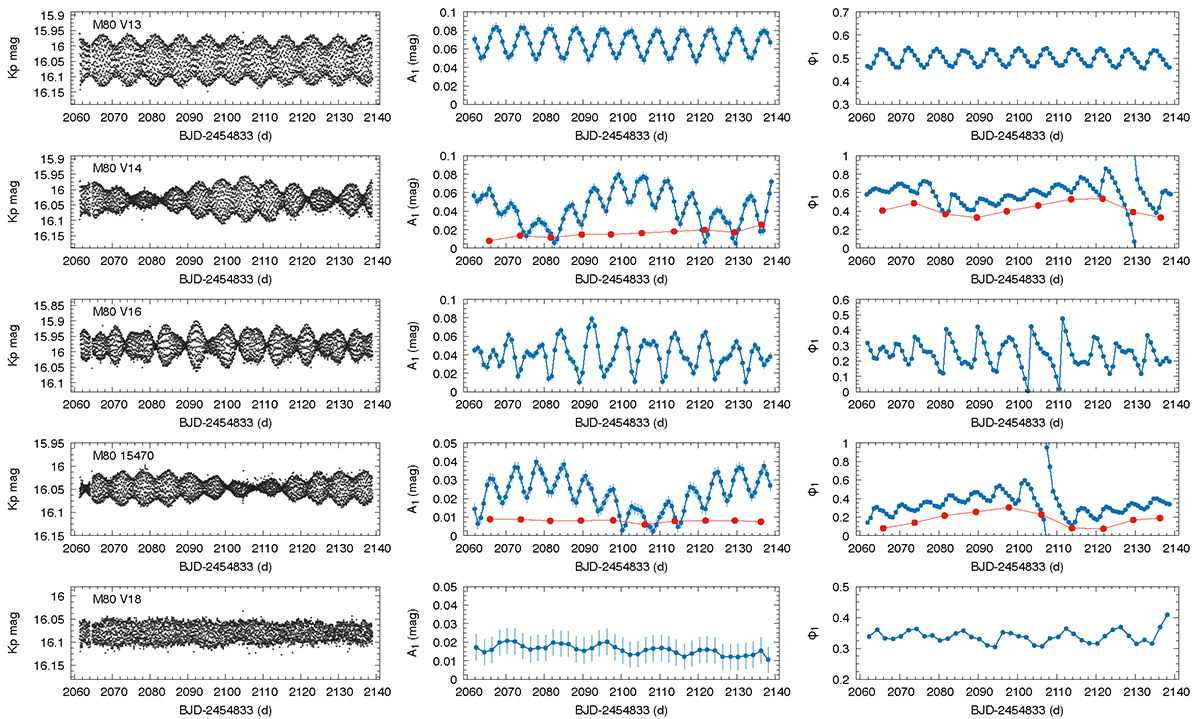
Fig. 5.
Download original image
Modulated RRc stars. Left column: K2 light curves. Middle column, in blue: Variation of A1, the Fourier-amplitude of the pulsation frequency. Right column, in blue: Variation of ϕ1, the Fourier phase. In red, middle and right: Variation of the amplitude and phase of the A1 curve when fitted with the shorter modulation frequency.
Current usage metrics show cumulative count of Article Views (full-text article views including HTML views, PDF and ePub downloads, according to the available data) and Abstracts Views on Vision4Press platform.
Data correspond to usage on the plateform after 2015. The current usage metrics is available 48-96 hours after online publication and is updated daily on week days.
Initial download of the metrics may take a while.