Fig. 4
Download original image
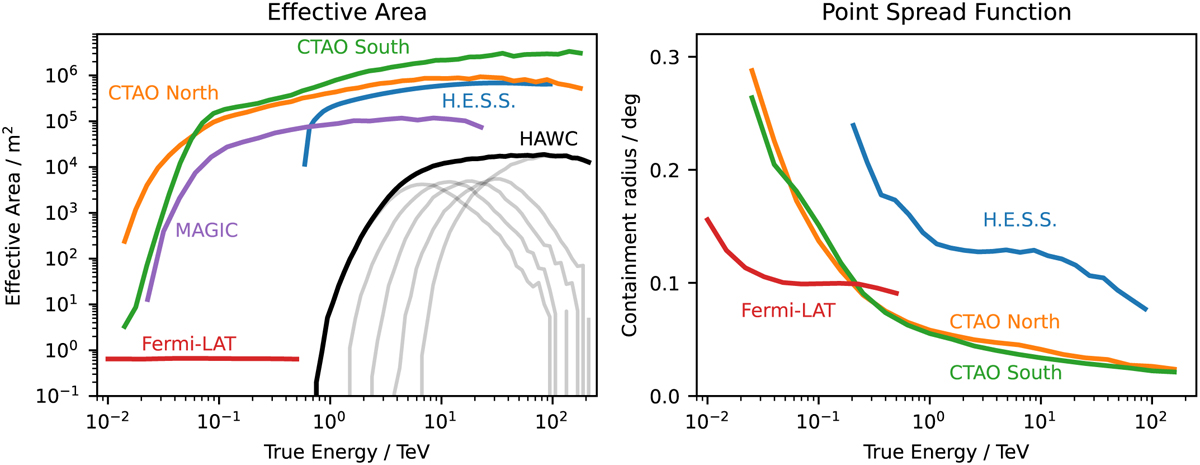
Using gammapy.irf to read and plot instrument response functions. The left panel shows the effective area as a function of energy for the CTA, H.E.S.S., MAGIC, HAWC and Fermi-LAT instruments. The right panel shows the 68% containment radius of the PSF as a function of energy for the CTA, H.E.S.S. and Fermi-LAT instruments. The CTA IRFs are from the “prod5” production for the alpha configuration of the south and north array. The H.E.S.S. IRFs are from the DL3 DR1, using observation ID 033787. The MAGIC effective area is computed for a 20 min observation at the Crab Nebula coordinates. The Fermi-LAT IRFs use “pass8” data and are also taken at the position of the Crab Nebula. The HAWC effective area is shown for the event classes NHit = 5–9 as light gray lines along with the sum of all event classes as a black line. The HAWC IRFs are taken from the first public release of events data by the HAWC collaboration. All IRFs do not correspond to the latest performance of the instruments, but still are representative of the detector type and energy range. We exclusively relied on publicly available data provided by the collaborations. The data are also available in the gammapy-data repository.
Current usage metrics show cumulative count of Article Views (full-text article views including HTML views, PDF and ePub downloads, according to the available data) and Abstracts Views on Vision4Press platform.
Data correspond to usage on the plateform after 2015. The current usage metrics is available 48-96 hours after online publication and is updated daily on week days.
Initial download of the metrics may take a while.