Fig. 2
Download original image
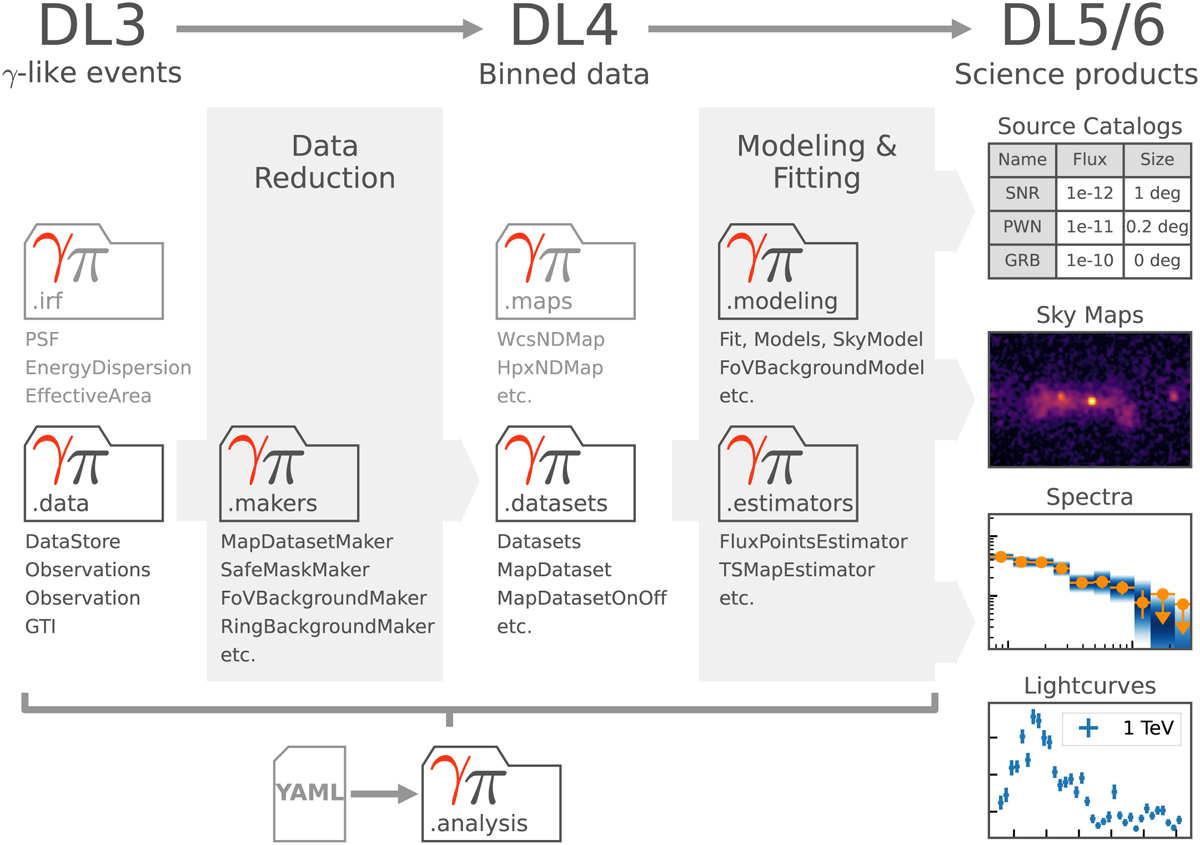
Gammapy sub-package structure and data analysis workflow. The top row defines the different levels of data reduction, from lists of γ-ray-like events on the left (DL3), to high-level scientific products (DL5) on the right. The direction of the data flow is illustrated with the gray arrows. The gray folder icons represent the different sub-packages in Gammapy and names given as the corresponding Python code suffix, e.g., gammapy. data. Below each icon there is a list of the most important objects defined in the sub-package. The light gray folder icons show the sub-packages for the most fundamental data structures such as maps and IRFs. The bottom of the figure shows the high-level analysis sub-module with its dependency on the YAML file format.
Current usage metrics show cumulative count of Article Views (full-text article views including HTML views, PDF and ePub downloads, according to the available data) and Abstracts Views on Vision4Press platform.
Data correspond to usage on the plateform after 2015. The current usage metrics is available 48-96 hours after online publication and is updated daily on week days.
Initial download of the metrics may take a while.