Fig. 15
Download original image
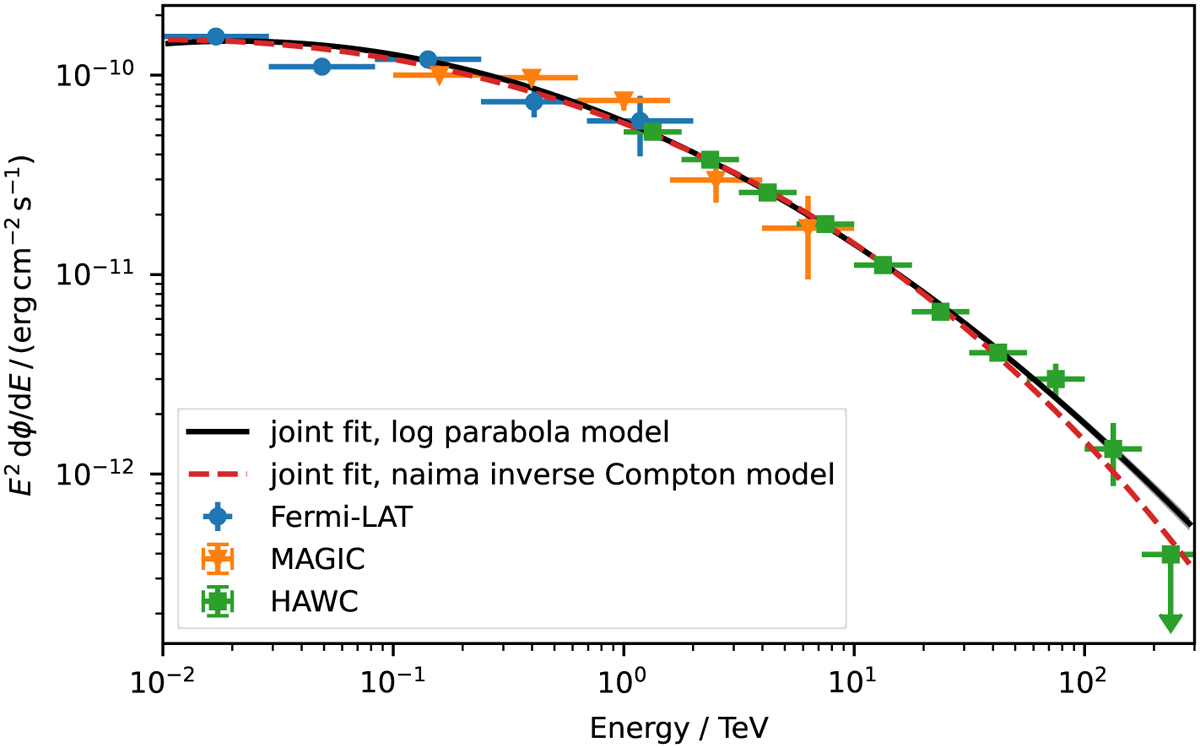
Multi-instrument spectral energy distribution (SED) and combined model fit of the Crab Nebula. The colored markers show the flux points computed from the data of the different listed instruments. The horizontal error bar illustrates the width of the chosen energy band (EMin, EMax). The marker is set to the log-center energy of the band, that is defined by ![]() . The vertical errors bars indicate the 1σ error of the measurement. The downward facing arrows indicate the value of 2σ upper flux limits for the given energy range. The black solid line shows the best fit model and the transparent band its 1σ error range. The band is too small be visible.
. The vertical errors bars indicate the 1σ error of the measurement. The downward facing arrows indicate the value of 2σ upper flux limits for the given energy range. The black solid line shows the best fit model and the transparent band its 1σ error range. The band is too small be visible.
Current usage metrics show cumulative count of Article Views (full-text article views including HTML views, PDF and ePub downloads, according to the available data) and Abstracts Views on Vision4Press platform.
Data correspond to usage on the plateform after 2015. The current usage metrics is available 48-96 hours after online publication and is updated daily on week days.
Initial download of the metrics may take a while.