Fig. 14
Download original image
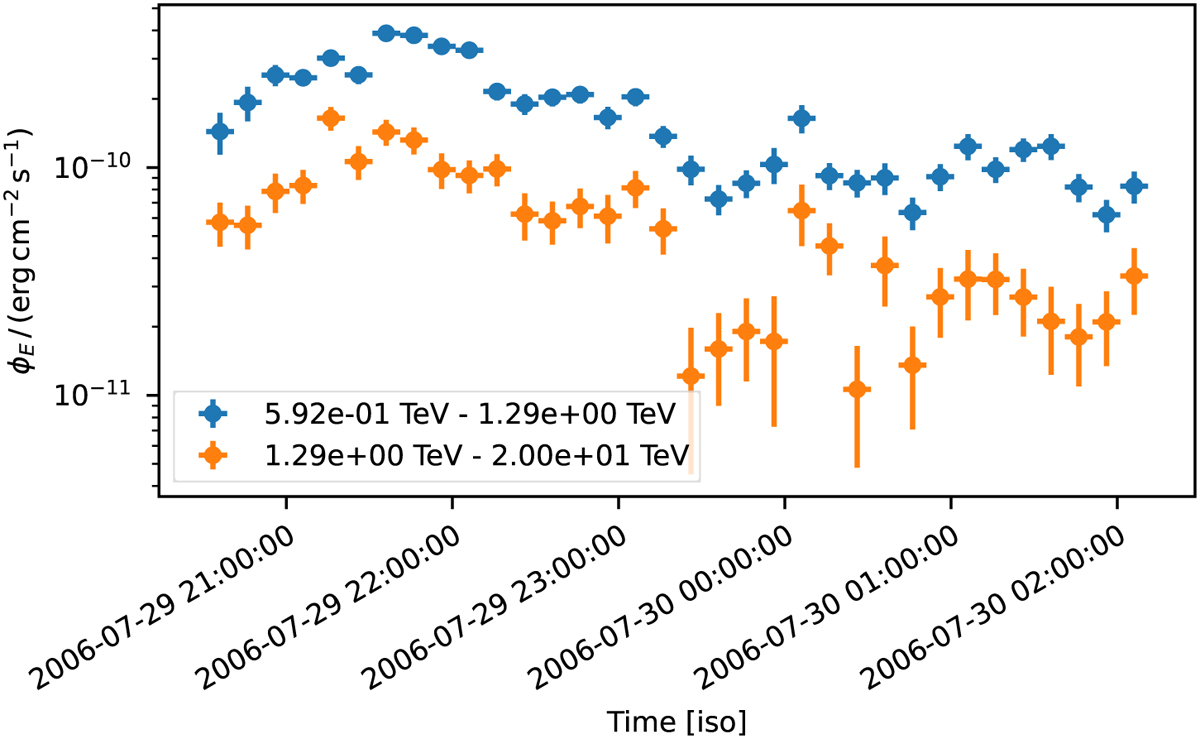
Binned PKS 2155-304 light curve in two different energy bands as observed by the H.E.S.S. telescopes in 2006. The colored markers show the flux points in the different energy bands: the range from (0.5 TeV to 1.5 TeV is shown in blue, while the range from 1.5 TeV to 20 TeV) is shown in orange. The horizontal error illustrates the width of the time bin of 10 min. The vertical error bars show the associated asymmetrical flux errors. The marker is set to the center of the time bin.
Current usage metrics show cumulative count of Article Views (full-text article views including HTML views, PDF and ePub downloads, according to the available data) and Abstracts Views on Vision4Press platform.
Data correspond to usage on the plateform after 2015. The current usage metrics is available 48-96 hours after online publication and is updated daily on week days.
Initial download of the metrics may take a while.