Fig. 12
Download original image
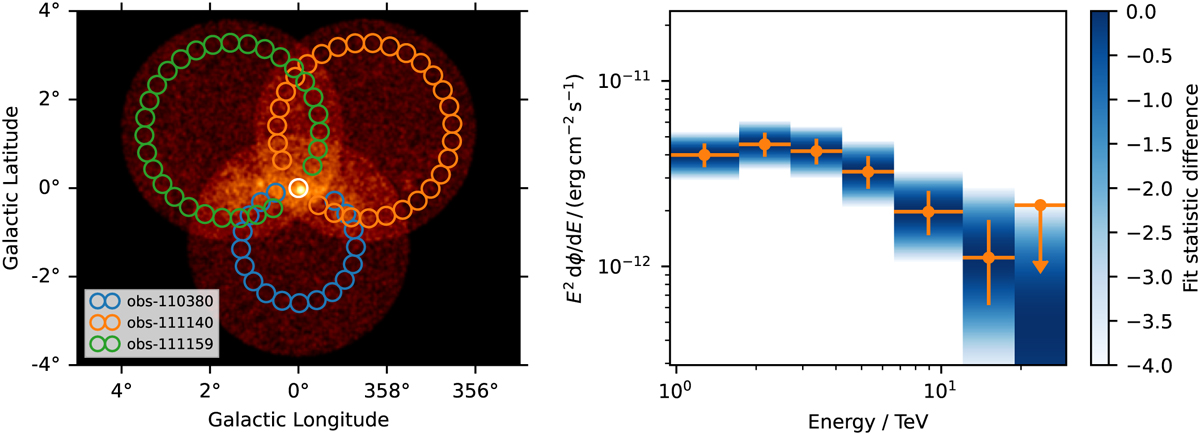
Example of a 1D spectral analysis of the Galactic Center for three simulated observations from the first CTA data challenge. The left image shows the maps of counts with the signal region in white and the reflected background regions for the three different observations overlaid in different colors. The right image shows the resulting spectral flux points and their corresponding log-likelihood profiles. The flux points are shown in orange, with the horizontal bar illustrating the width of the energy bin and the vertical bar the 1σ error. The log-likelihood profiles for each enetgy bin are shown in the background. The colormap illustrates the difference of the log-likelihood to the log-likelihood of the best fit value.
Current usage metrics show cumulative count of Article Views (full-text article views including HTML views, PDF and ePub downloads, according to the available data) and Abstracts Views on Vision4Press platform.
Data correspond to usage on the plateform after 2015. The current usage metrics is available 48-96 hours after online publication and is updated daily on week days.
Initial download of the metrics may take a while.