Fig. 8.
Download original image
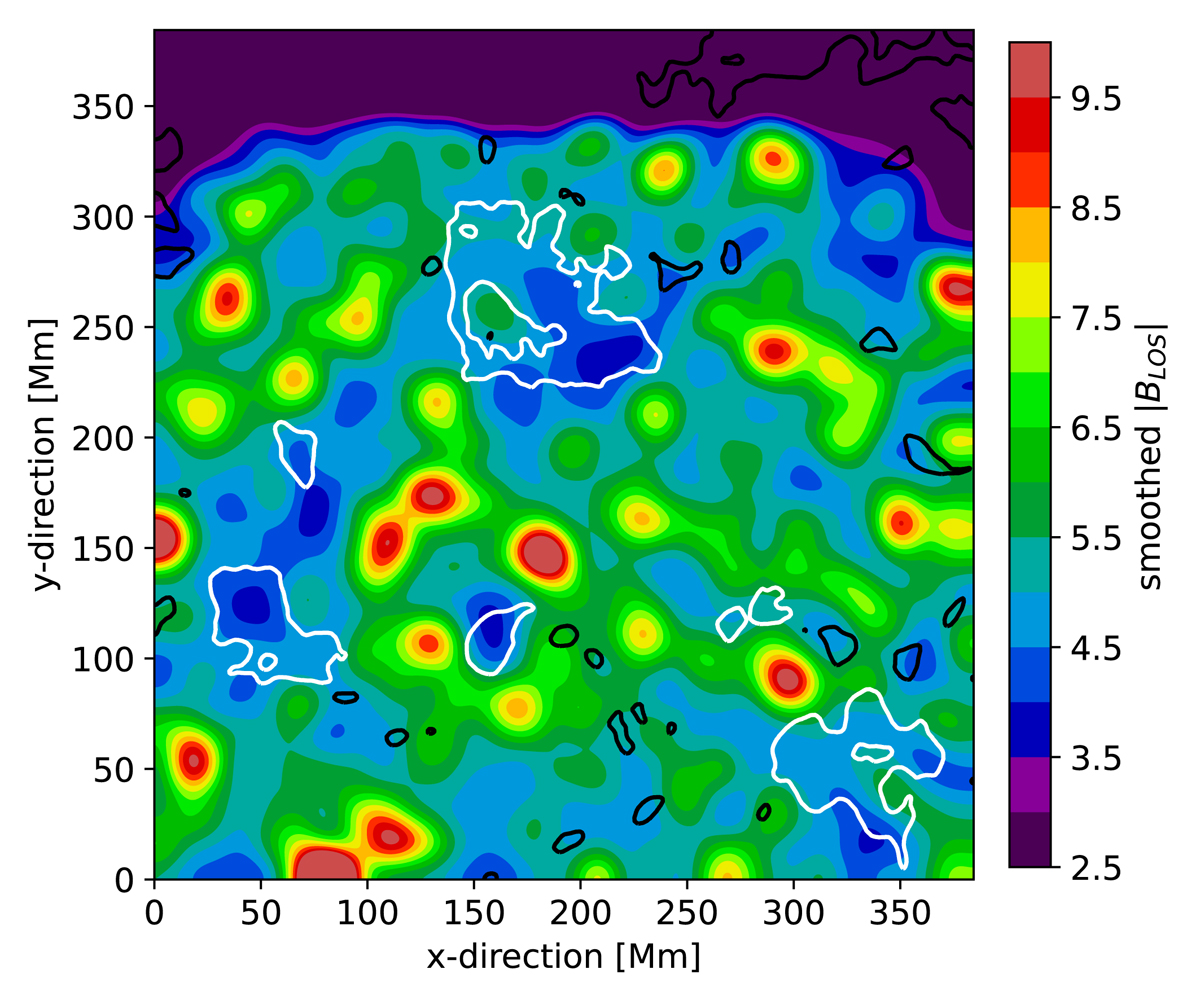
Weak magnetic fields and coronal voids. To highlight the regions of weaker magnetic field, we smoothed the LOS magnetic field strength |BLOS| using a Gaussian kernel of 20 Mm FWHM. To emphasise the structuring, we use a discrete colour table. The weak-field regions are found in areas displayed mainly in blue. The contours of coronal voids are overplotted (the six major voids listed in Table 1 in thick white, smaller voids in black; same contours as in Fig. 1). See Sect. 3.3.3.
Current usage metrics show cumulative count of Article Views (full-text article views including HTML views, PDF and ePub downloads, according to the available data) and Abstracts Views on Vision4Press platform.
Data correspond to usage on the plateform after 2015. The current usage metrics is available 48-96 hours after online publication and is updated daily on week days.
Initial download of the metrics may take a while.