Fig. 7.
Download original image
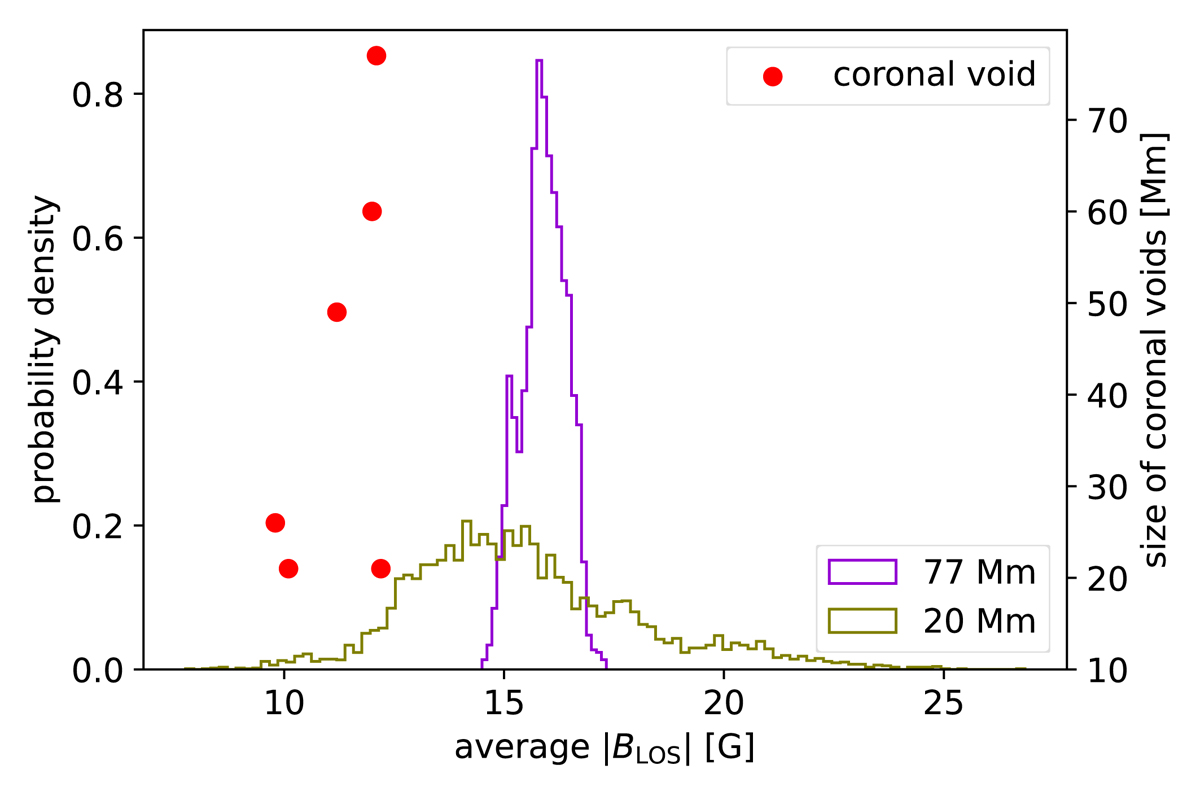
Average |BLOS| in QS areas. The QS areas of the whole FOV are sub-divided into identical tiles. For each tile the mean |BLOS| is calculated. Histograms of the mean |BLOS| for tiles with a size corresponding to 77 and 20 Mm are shown in purple and olive, respectively. The red dots mark the mean |BLOS| values derived for the six major voids (cf. Table 1) as a function of their size (right axis). See Sect. 3.3.2.
Current usage metrics show cumulative count of Article Views (full-text article views including HTML views, PDF and ePub downloads, according to the available data) and Abstracts Views on Vision4Press platform.
Data correspond to usage on the plateform after 2015. The current usage metrics is available 48-96 hours after online publication and is updated daily on week days.
Initial download of the metrics may take a while.