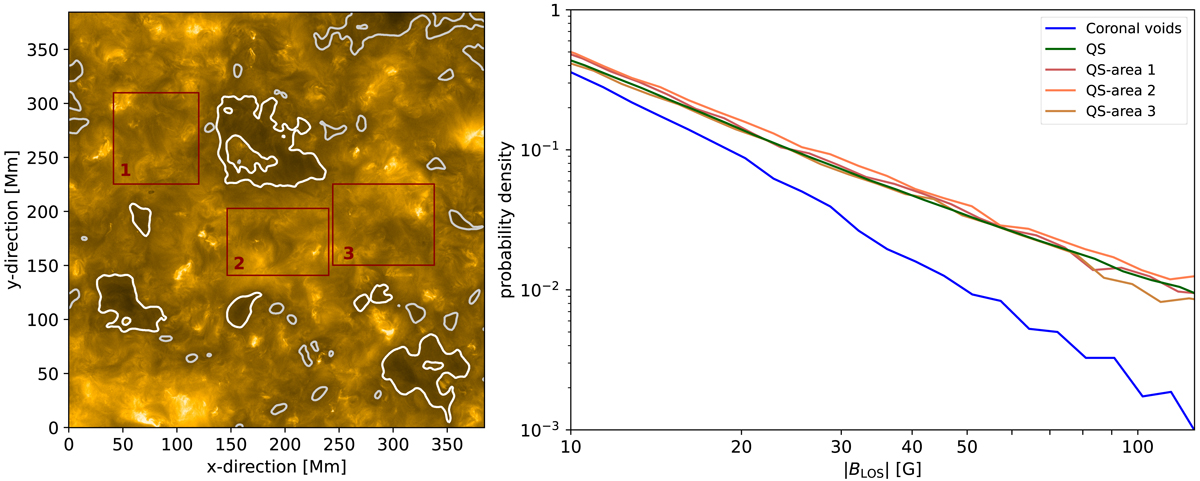
Fig. 6.
Download original image
Histograms of the absolute LOS magnetic field in coronal voids and the QS. The left panel shows the HRIEUV image, similar to Fig. 1, along with the regions of interest, from which we derived the histograms of |BLOS| that are displayed in the right panel. The solid blue line shows the histogram for all major voids combined (thick white contours in the left panel). The red, orange, and brown lines show the histograms within the three squares in the left panel, all covering small parts of QS. The green histogram is for the whole FOV except for the major voids. See Sect. 3.3.2.
Current usage metrics show cumulative count of Article Views (full-text article views including HTML views, PDF and ePub downloads, according to the available data) and Abstracts Views on Vision4Press platform.
Data correspond to usage on the plateform after 2015. The current usage metrics is available 48-96 hours after online publication and is updated daily on week days.
Initial download of the metrics may take a while.