Fig. 4.
Download original image
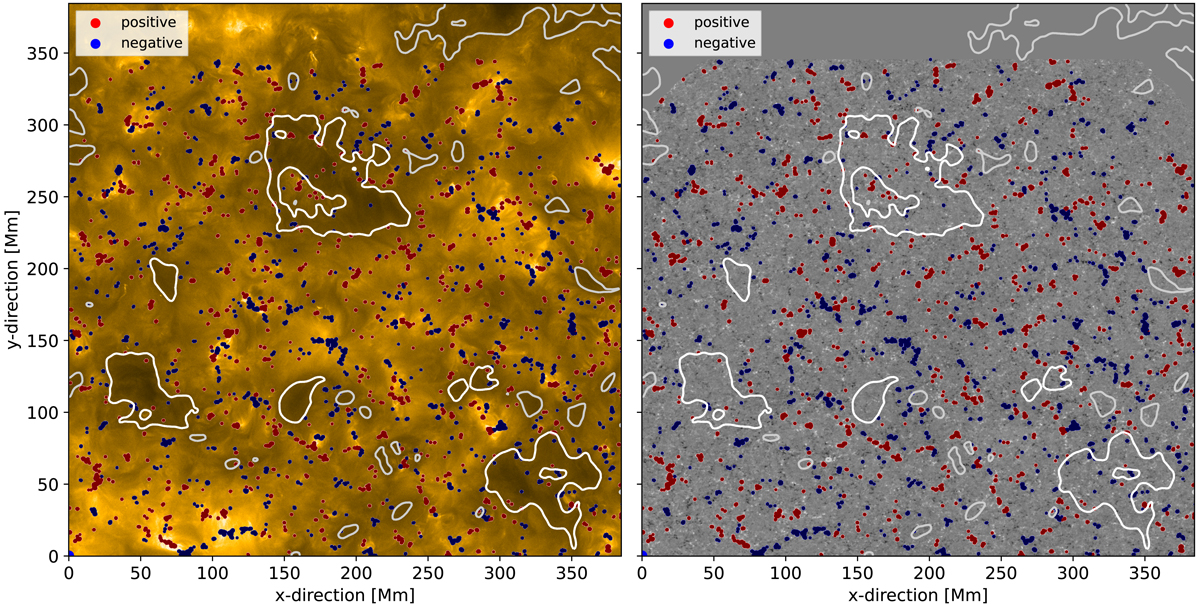
Strong-field regions in voids and QS. The background image is the same as in Fig. 1, i.e., the 174 Å image from HRIEUV (left) and the magnetogram from SO/PHI-HRT (right). To highlight strong-field regions, we colour the regions of magnetic field with a strength above ±50 G in red and blue for positive and negative magnetic polarities, respectively. See Sect. 3.3.2.
Current usage metrics show cumulative count of Article Views (full-text article views including HTML views, PDF and ePub downloads, according to the available data) and Abstracts Views on Vision4Press platform.
Data correspond to usage on the plateform after 2015. The current usage metrics is available 48-96 hours after online publication and is updated daily on week days.
Initial download of the metrics may take a while.