Fig. 3.
Download original image
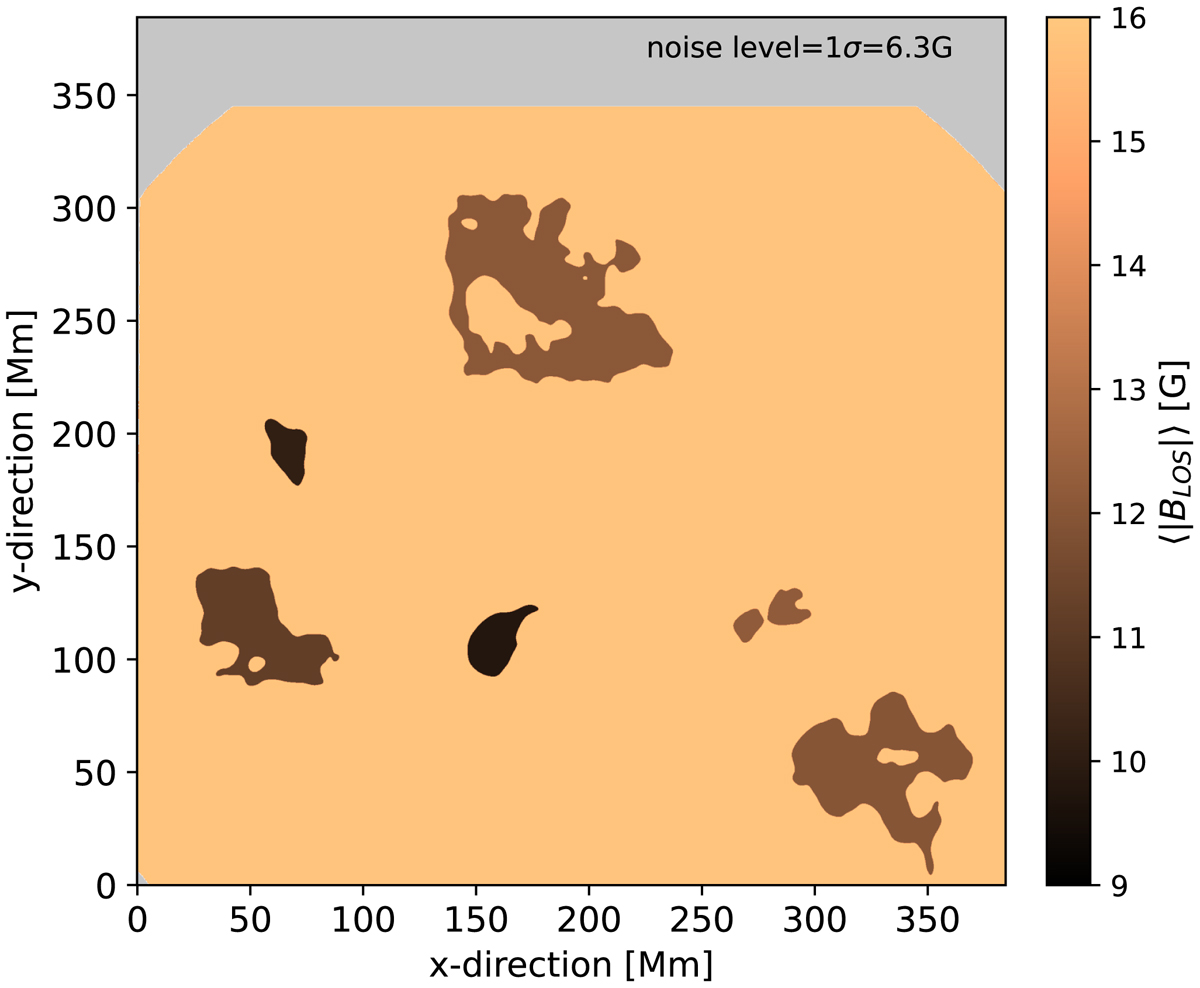
Illustration of the absolute LOS magnetic field strength in major voids and QS. For the six major voids, the average of the LOS field, |BLOS|, is calculated and then plotted as a single value within the contour of the respective void (see also Fig. 1 and Table 1). Likewise, the QS region is coloured corresponding to the average |BLOS| of the QS. See Sect. 3.3.1.
Current usage metrics show cumulative count of Article Views (full-text article views including HTML views, PDF and ePub downloads, according to the available data) and Abstracts Views on Vision4Press platform.
Data correspond to usage on the plateform after 2015. The current usage metrics is available 48-96 hours after online publication and is updated daily on week days.
Initial download of the metrics may take a while.