Fig. 11.
Download original image
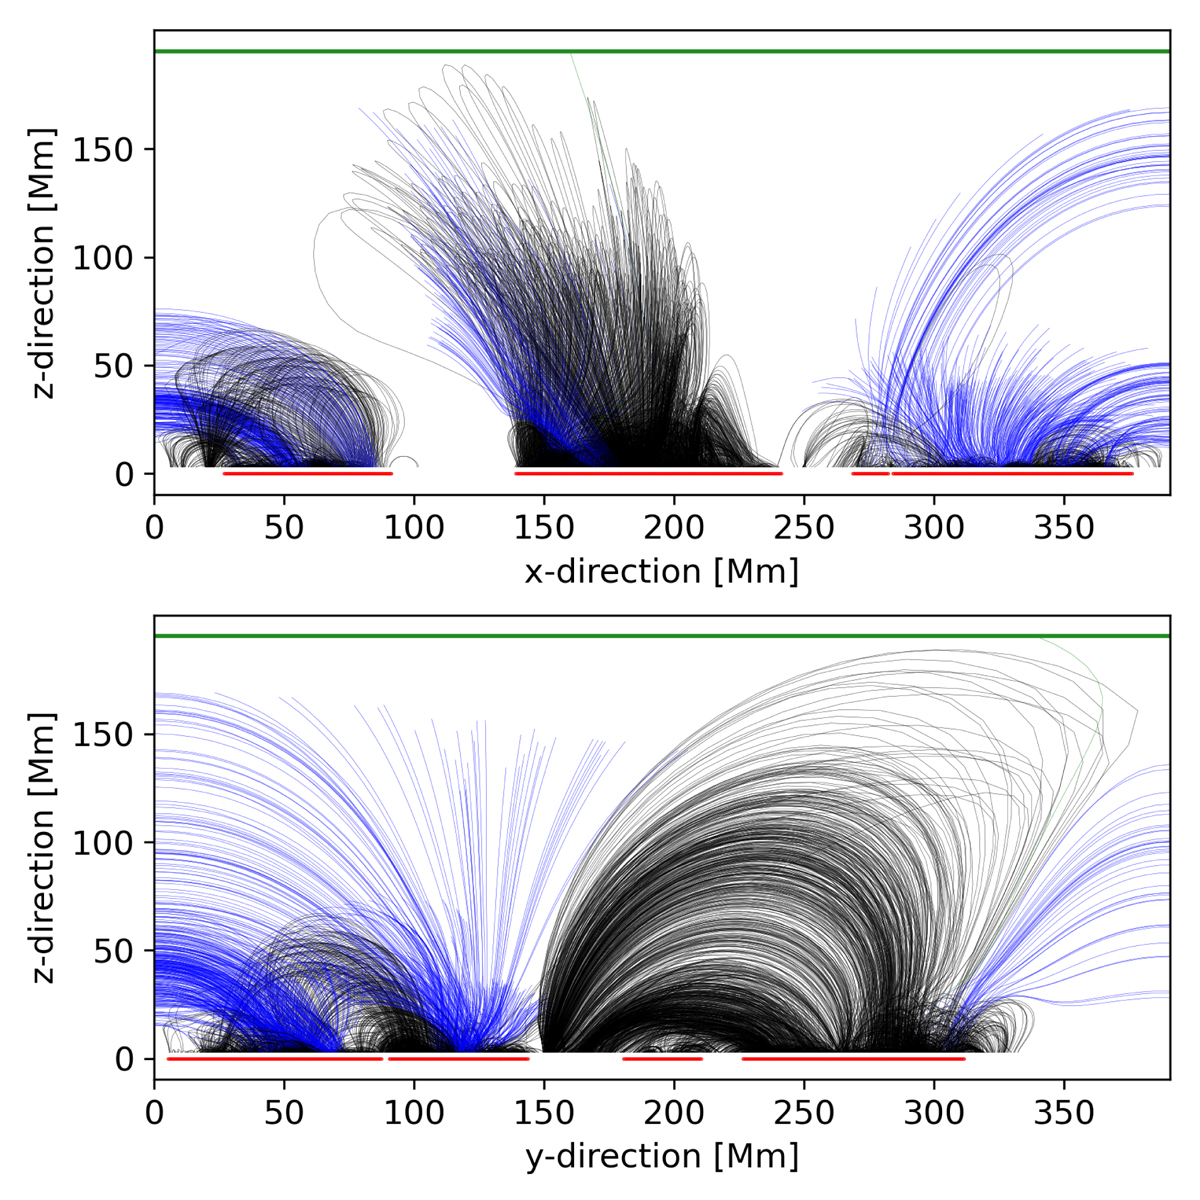
Field lines traced within a potential field extrapolation. The field lines originate from a regular horizontal grid (with a 2-pixel grid scale) 2 Mm above the photosphere, but only from grid cells located within coronal voids (although the other footpoint can end outside a void). Every tenth field line is displayed here and has been projected onto the x − z and y − z planes. Field lines that reach the upper boundary, leave the simulation box sideways, and close back to the photosphere are shown in green, blue, and black, respectively. The horizontal green line denotes the upper boundary of the simulation box. The red lines at the bottom of both panels indicate the positions of the coronal voids.
Current usage metrics show cumulative count of Article Views (full-text article views including HTML views, PDF and ePub downloads, according to the available data) and Abstracts Views on Vision4Press platform.
Data correspond to usage on the plateform after 2015. The current usage metrics is available 48-96 hours after online publication and is updated daily on week days.
Initial download of the metrics may take a while.