Fig. 1.
Download original image
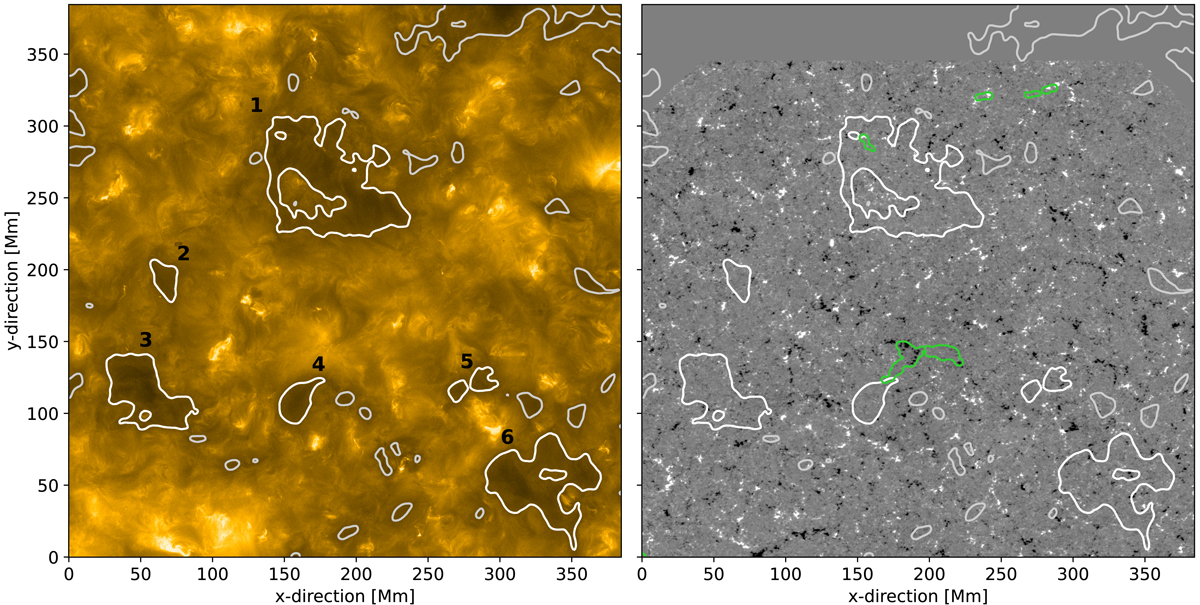
Overview of observations. These high-resolution images show the (almost) full FOV of EUI HRIEUV (left) and SO/PHI-HRT (right) and were taken on 2021 February 23 at 17:13:26 and 17:00:45, respectively. Disk centre (as seen from Solar Orbiter) is roughly in the centre of the images, and north is up. Coordinates are given in Mm on the Sun. The HRIEUV image around 174 Å is shown on a linear scale, and the SO/PHI-HRT map shows the LOS magnetogram saturated at ±50 G with white and black indicating positive and negative polarities, respectively. Because the FOV of PHI is shifted somewhat towards the south with respect to EUI, the top part of the magnetogram does not show data (flat grey). All white or grey contours show EUI intensity levels of 75% of the average intensity and highlight the dark coronal voids seen in the HRIEUV. The six major voids are indicated by thick white outlines and numbered according to the list in Table 1 (see Sect. 3.1). The green contours mark the regions on the surface from where the open field lines originate. For the discussion, see Sect. 3.5.
Current usage metrics show cumulative count of Article Views (full-text article views including HTML views, PDF and ePub downloads, according to the available data) and Abstracts Views on Vision4Press platform.
Data correspond to usage on the plateform after 2015. The current usage metrics is available 48-96 hours after online publication and is updated daily on week days.
Initial download of the metrics may take a while.