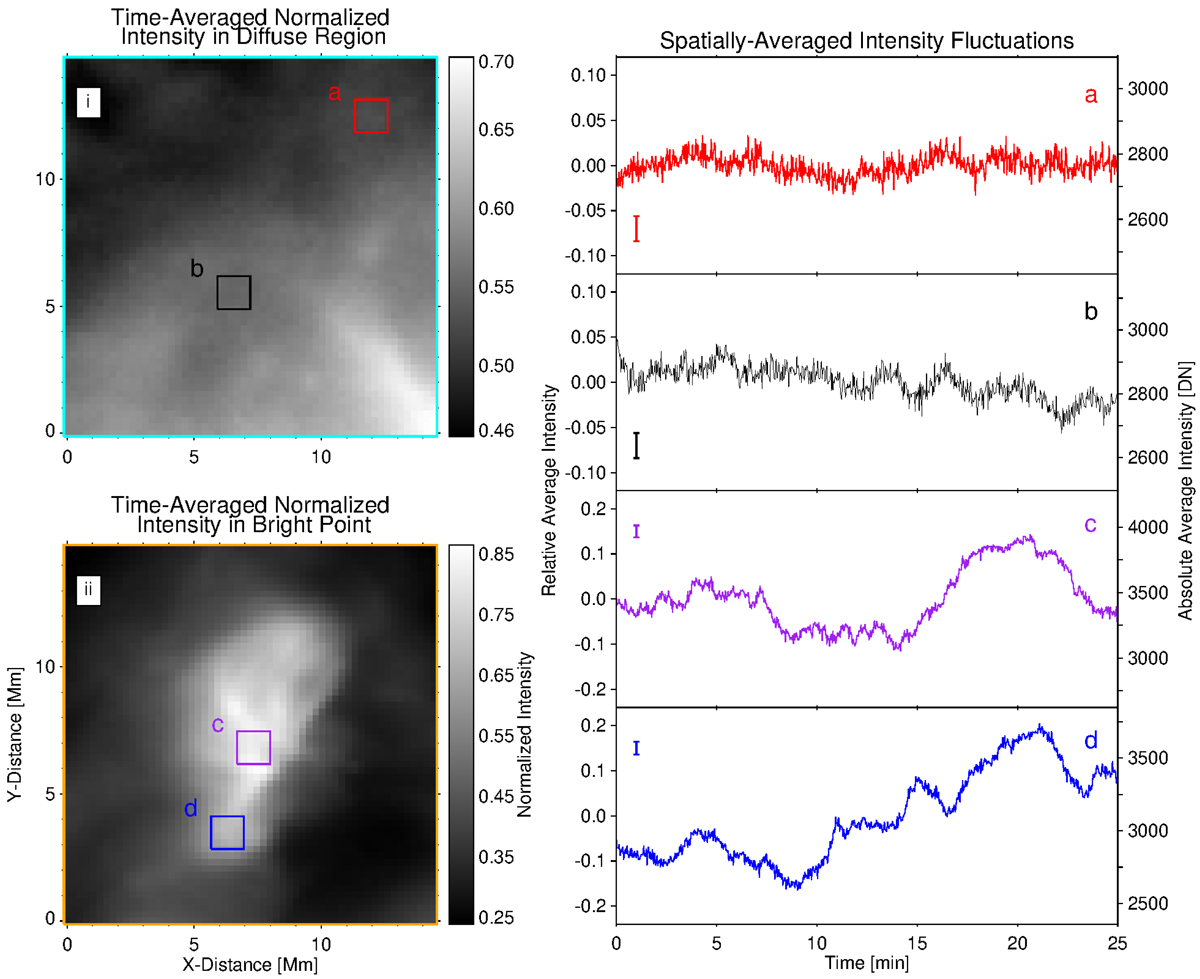
Fig. 4.
Download original image
Intensity fluctuations in diffuse and bright point regions. The two left panels show the zoomed-in FOV covering the diffuse region (panel i) and bright point (panel ii) outlined by the cyan and orange boxes in Fig. 1b, respectively. Each image is the same time-averaged and normalized figure as shown in Fig. 1b, except the intensity range shown is further limited to the minimum and maximum for each zoomed-in FOV. Within the regions of interest, four smaller sub-fields a to d are outlined. Each of these boxes has the same area. The spatially averaged relative (left y-axis) and absolute (right y-axis) intensities for the respective sub-fields are plotted as a function of time on the right in panels a–d. The vertical bars shown in each of these panels represent the maximum error for each time series (see Appendix A).
Current usage metrics show cumulative count of Article Views (full-text article views including HTML views, PDF and ePub downloads, according to the available data) and Abstracts Views on Vision4Press platform.
Data correspond to usage on the plateform after 2015. The current usage metrics is available 48-96 hours after online publication and is updated daily on week days.
Initial download of the metrics may take a while.