| Issue |
A&A
Volume 662, June 2022
|
|
|---|---|---|
| Article Number | A7 | |
| Number of page(s) | 12 | |
| Section | The Sun and the Heliosphere | |
| DOI | https://doi.org/10.1051/0004-6361/202142884 | |
| Published online | 26 May 2022 | |
Moving structures in ultraviolet bright points: Observations from Solar Orbiter/EUI
Key Laboratory of Dark Matter and Space Astronomy, Purple Mountain Observatory, CAS, Nanjing 210023, PR China
e-mail: lidong@pmo.ac.cn
Received:
11
December
2021
Accepted:
4
April
2022
Context. Moving structures have been detected in coronal bright points and in a solar flare in active regions that are bidirectional, symmetrical, simultaneous, and quasi-periodic. These could be regarded as observational evidence of plasma outflows via magnetic reconnection.
Aims. We explored pairs of moving structures in fifteen ultraviolet bright points (UBPs), which were observed in the quiet Sun or inside a small active region on 19 November 2020.
Methods. The UBPs were measured by the High Resolution (HRI) Telescopes of the Extreme Ultraviolet Imager (EUI) on board the Solar Orbiter (SolO) in two passbands, HRIEUV 174 Å and HRILyα 1216 Å. The pairs of moving structures are identified in time-distance slices along curved slits of UBPs and their quasi-periods are determined from the fast Fourier transform and wavelet analysis methods.
Results. Moving structures observed in ten UBPs, starting from their bright cores and propagating toward two ends, are interpreted as diverging motions of bidirectional moving structures. These moving structures are also characterized by simultaneity and symmetry and in the case of seven UBPs, they exhibit quasi-periodicity. Moving structures seen in another five UBPs, originating from double ends, moving closer, and merging together are manifested as converging motions. A sympathetic UBP induced by the primary UBP is observed at the edge of a small active region and their moving structures also show the converging motion.
Conclusions. The diverging motions of bidirectional moving structures could be generated by outflows after magnetic reconnections. The converging motions of two moving structures might be caused by inflows through the magnetic reconnection or could also be interpreted as upflows driven by the chromospheric evaporation.
Key words: Sun: corona / Sun: chromosphere / Sun: UV radiation / magnetic reconnection
© D. Li 2022
 Open Access article, published by EDP Sciences, under the terms of the Creative Commons Attribution License (https://creativecommons.org/licenses/by/4.0), which permits unrestricted use, distribution, and reproduction in any medium, provided the original work is properly cited.
This article is published in open access under the Subscribe-to-Open model. Subscribe to A&A to support open access publication.
1. Introduction
Coronal bright points (CBP) are ubiquitous small-scale enhanced emissions in the lower corona over the Sun, which are a fundamental class of solar activities (see Madjarska 2019, for a recent review). They are easily observed in the ultraviolet and extreme-ultraviolet (UV/EUV) and soft X-ray (SXR) wavelengths (e.g., Golub et al. 1974; Li et al. 2013; Zhang et al. 2014; Alipour & Safari 2015; Mou et al. 2018). They often reveal loop-shaped features that connect magnetic fields with opposite polarities in quiet-Sun or active regions, as well as in coronal holes (Harvey et al. 1993; Li & Ning 2012; Li et al. 2013; Zhang et al. 2012; Mou et al. 2016; Galsgaard et al. 2019). They have a length range of about 5−30 Mm (Golub et al. 1974; Habbal et al. 1990; Ueda et al. 2010; Mou et al. 2018) and their duration covers a wide range, varying from a few minutes to several hours or even longer (Golub et al. 1976; Habbal & Withbroe 1981; Harvey et al. 1993; Zhang et al. 2001). Their lengths and durations are often related to the evolution of magnetic fields in the underlying photosphere (Golub et al. 1977; Yokoyama & Shibata 1995; Alexander et al. 2011). Quasi-periodic oscillations with periods from minutes to hours have also been reported for CBPs (Tian et al. 2008; Samanta et al. 2015), which can be found everywhere at the solar atmosphere and appear to coincide with magnetic neutral lines in a significant way. This aspect is expected to play an important role in understanding coronal heating (Priest et al. 1994; Shibata et al. 2007; Tian et al. 2007; Hosseini Rad et al. 2021).
Magnetic reconnection is a basic dynamical process of the energy release in solar eruptions, namely, solar flares (Priest & Forbes 2002; Su et al. 2013), CBPs (Priest et al. 1994; Ning et al. 2020), explosive events in transition regions (Innes et al. 1997, 2015; Huang et al. 2019), plasma jets (Jiang et al. 2013; Tian et al. 2014; Tiwari et al. 2019; Shen 2021), blinkers (Chae et al. 2000; Subramanian et al. 2008), and UV/EUV bursts (Peter et al. 2014; Young et al. 2018; Tian et al. 2021), and so on. Thus, the Sun could provide a broad range of sizes for the observational features of magnetic reconnection, such as: reconnection inflows and outflows of solar flares (Hara et al. 2011; Liu et al. 2013) and CBPs (Yokoyama & Shibata 1995; Ning & Guo 2014; Li et al. 2016a; Shokri et al. 2022) in solar active regions, bidirectional plasma jets of transition region explosive events (Innes et al. 1997; Huang et al. 2014; Li et al. 2018), the magnetic null point in CBPs (Sun et al. 2012; Zhang et al. 2012), and the flux rope in solar active regions (Cheng et al. 2013; Li et al. 2016b) or in coronal mass ejections (Lin et al. 2005; Cheng et al. 2020), and so on. These observational evidences are seen in multiple layers of the solar atmosphere, such as the corona, the transition region, and the chromosphere, benefitting from imaging and spectroscopic observations with high-spatial or high-cadence resolutions (e.g., Peter et al. 2014; Tian et al. 2014; Tiwari et al. 2019; Yan et al. 2020; Chitta et al. 2021a).
In the Solar Orbiter (SolO; Müller et al. 2020) era, using High Resolutions (HRI) Telescopes of the Extreme Ultraviolet Imager (EUI; Rochus et al. 2020), three groups of small-scale brightening events in the quiet Sun have been reported. One group has been named as a “campfire” (Berghmans et al. 2021; Mandal et al. 2021; Zhukov et al. 2021) and it has been assumed that it could be driven by the component reconnection, for instance, loops reconnecting at coronal heights (Chen et al. 2021; Panesar et al. 2021). The second one is a “microjet”, which is mostly likely produced by the low height reconnection with small-scale chromospheric fields. Moreover, its energy is roughly equal to the energy released from the predicted nanoflare theory (Hou et al. 2021). The third one is known as a “fast repeating jet” and it shows a bidirection or a unidirection at a very short time scale of about 20 s (Chitta et al. 2021b). Those three groups of brightening events are all associated with the reconnection model and reveal the similar transient nature. They are regarded as the observational signatures of small-scale magnetic reconnection in the quiet-Sun region.
The classical 2-D reconnection model (Sturrock & Coppi 1964) suggested that bidirectional outflows via magnetic reconnection could be produced simultaneously, and their emissions along propagation paths may be seen in the EUV and optical wavelengths, while the reconnection flows were regarded as inflows or outflows. Based on this idea, Ning & Guo (2014) investigated several pairs of moving structures originating from the brightness core of a CBP, and they were found to be characterized by bidirections, symmetry, simultaneity, and quasi-periodicity. Li et al. (2016a) further found that a small pair of positive and negative magnetic fields moved gradually closer to each other during bidirectional moving structures in another CBP. Therefore, those bidirectional moving structures were attributed to observational outflows after magnetic reconnections. Similar bidirectional moving structures were also found in a C-class flare (Ning 2016) and in a small-scale loop system (Ning et al. 2020), confirming that they are indeed the results of a small-scale magnetic reconnection. Zhang & Ji (2013) studied moving structures between a primary CBP and its sympathetic CBPs. The moving structures were found to be propagating upward along large loop-like paths and they were regarded as the signature of chromosphere evaporation after magnetic reconnection. It should be pointed out that all above CBPs and flares were observed within active regions on the Sun.
In particular, CBPs are a very specific class of events characterized by hot plasma emissions and by a typical topology of the photospheric magnetic field, such as the small-scale and new-emergence magnetic field that often exhibits opposite polarities (Golub et al. 1976; Priest et al. 1994; Alexander et al. 2011; Li & Ning 2012). In this study, the novel SolO/EUI data obtained during cruise phase is used to investigate bidirectional moving structures in quiet and active regions. We only have images at EUI 174 Å and 1216 Å, but we lack images at higher temperatures or photospheric magnetic field maps. Therefore, the studied features cannot be identified as CBPs, and they are simply referred to as UV bright points (UBPs). They most likely also sit at the larger sizes, longer lifetimes end of the campfires’ distribution (e.g., Berghmans et al. 2021). This article is organized as follows: Sect. 2 describes the observations. Section 3 presents our main results. Section 4 summarizes our conclusion and offers a discussion.
2. Observations
The observational data were captured by two HRI telescopes of SolO/EUI, with the observed passbands centered at 174 Å and 1216 Å, respectively. The first telescope, namely, HRIEUV, is dominated by two emission lines of Fe IX and Fe X in the lower corona, which has a formation temperature of about 1 MK. The second, HRILyα, is dominated by the Lyα emission of neutral hydrogen line in the upper chromosphere (Berghmans et al. 2021; Chen et al. 2021). The data studied here were obtained on 19 November 2020 over about 3 hours. They are divided into three sets, that is, from 12:00 UT to 12:39 UT ( ), from 13:00 UT to 13:39 UT (
 ), and from 14:00 UT to 14:39 UT (
 ), and each acquired at a time cadence of 15 s. At the time of observations, SolO was located at 121.1° west in solar longitude from the Earth-Sun line. Thus, it looked at a different side of the Sun – one that is not observable with telescopes in Earth orbit, namely, the Solar Dynamics Observatory (SDO). The distance between SolO and the Sun was about 0.92 AU, thus, the pixel scale was about 328 km pixel−1 for HRIEUV images and it was about 686 km pixel−1 for HRILyα images as these were binned 2 × 2 aboard.
We analyzed the Level 2 (L2) data from the EUI Data Release 3.01, which are distributed by the EUI team. We performed a cross-correlation to coalign the HRIEUV and HRILyα images, as shown in Fig. 1. Fifteen UBPs were selected to investigate their kinetic behaviors, as indicated by the numbers. It can be seen that most of these UBPs are located in the quiet-Sun region, while only three of them are situated inside (BP8 and BP10) or on the periphery of (BP3) a small active region (AR). Panel a shows that two UBPs (BP8 and BP10) appear almost in the same position but at different times, suggesting that they are homologous UBPs. It appears that all these UBPs are located at the boundary of chromospheric network as seen in the Lyα image, as shown in Fig. 1b. This is also a general characteristic of campfires (see Berghmans et al. 2021). We also note that EUI images are easily saturated with regard to large-scale phenomena such as coronal loops. Here, we investigate the small-scale UBPs and there are only a few saturated pixels, which have little impact on our results.
 |
Fig. 1. Snapshots in HRIEUV (a) and HRILyα (b) passbands measured by SolO/EUI. Fifteen UBPs are marked by numbers, while cyan circles ( |
3. Results
3.1. Diverging motions of bidirectional moving structures
The identified UBPs show loop-like shapes, which are similar to the profile of CBPs in previous findings (e.g., Zhang & Ji 2013; Ning & Guo 2014; Li et al. 2016a). As an example, we plot the time-sequence images of one UBP (labeled “BP1”) in the quiet Sun region to display its evolution, as shown in Fig. 2. The top 12 panels show intensity images in HRIEUV 174 Å from 13:10:00 UT to 13:12:45 UT. It can be seen that some bright structures appear in these EUV 174 Å images. They begin with a bright patch, and then they are almost simultaneously expanding outward to two ends, for instance, they reveal a diverging motion. The bright structures expand along not a straight but a curved path, implying the loop-like shape. The middle 12 panels are intensity images in HRILyα 1216 Å during nearly the same time interval. There are also some bright structures in these Lyα 1216 Å images, which are underlying the UBP identified in EUV 174 Å, as indicated by the green contour. These bright structures in Lyα 1216 Å seem to expand slowly too. The bottom 12 panels draw running difference images in HRIEUV 174 Å. In this, we can see that a bright structure is separated into white and dark kernels, and the white kernel is always followed by a dark one. Moreover, they are simultaneously moving toward two ends, as shown by the magenta arrows, which is consistent with the expanding bright emission in intensity images. Therefore, we regarded them as moving structures (cf. Ning & Guo 2014; Li et al. 2016a; Ning et al. 2020).
 |
Fig. 2. Time sequence images with a small FOV of about 24 Mm × 24 Mm in HRIEUV (top 12 panels) and HRILyα (middle 12 panels) passbands, and running difference images (bottom 12 panels) in the HRIEUV passband. The green contours represent the HRIEUV emission at the level of 1000 DN s−1. Two cyan curves mark the curved slits along the UBP, and the green symbol of ‘*’ indicate the zero of y-axis in Fig. 3. The magenta arrows outline moving structures. |
In order to study the moving structures in detail, we plotted time-distance slices along the curved slits. The slits are outlined along a curved shape with two cyan lines in Fig. 2. A constant width of about 4 Mm is used, so that the bulk of this UBP brightness can be covered as much as possibly during its whole lifetime. Next, the intensities between two cyan curves were integrated at every observed time. Then, the time-distance slice was obtained in HRIEUV 174 Å, as shown in Fig. 3a, where the zero of y-axis is indicated by the green symbol of ‘*’ in Fig. 2. As can be seen, it becomes bright at roughly 13:09:00 UT, it expands and significantly enhances nearly simultaneously towards two opposite directions. It gradually disappears at about 13:16:00 UT. Thus the UBP lasts for ∼7 min, and the simultaneous brightenings could be regarded as bidirectional moving structures from the UBP bright core, as marked by the green line. The UBP size is estimated by the maximal length of the bright emission along the y-axis, which is ∼8.5 Mm. Panel b shows the time-distance slice derived from their running difference images. The moving structures are identified as oblique streaks, as labeled by the cyan and magenta arrows. In our observation, the moving structures are separated into white streaks followed by dark ones, which are consistent with the diverging motion of the white and dark kernels in running difference images. Their projected speeds are estimated to be about 46−55 km s−1, which are roughly equal. The moving structures always appear simultaneously, symmetrically and in pairs, as indicated by the green line and bidirectional arrows. In panel c, we present the time-distance slice in HRILyα 1216 Å, which shows a weak smooth brightness distribution during the UBP lifetime. We do not find similar moving structures, which is most likely due to the lower spatial resolution of the HRILyα images.
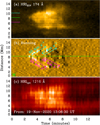 |
Fig. 3. Time-distance slices for BP1 derived from SolO/EUI image series in the HRIEUV passband (a) and its derivative (b), as well as the HRILyα passband (c), respectively. The green line indicates the UBP core, and the cyan and magenta lines outline the boundaries of the integrated flux in Fig. 4. The cyan and magenta arrows indicate bidirectional moving structures. |
The bidirectional moving structures appear to be intermittent and periodic. Thus, we perform a Morlet wavelet analysis (Torrence & Compo 1998), as shown in Fig. 4. Panels a and b plot normalized light curves (black) integrated over two arbitrary symmetrical locations, as indicated by the green and cyan (or magenta) lines in Fig. 3a. In order to decompose the slow- (green) and fast-varying components from the raw light curve, a fast Fourier transform (FFT) technique is applied (Ning 2017; Li et al. 2021). In this case, a cutoff threshold of 200 s is used, since the lifetime is only 7 min. Generally, the quasi-periodicity refers to at least three successive peaks in the observed light curve (see, Nakariakov et al. 2019; Zimovets et al. 2021, for reviews), as there is no reason to discuss the quasi-periodicity when only one or two emission peaks are detected, which might be solely a coincidence. Therefore, only the quasi-period less than 200 s is considered. In panels c and d, we draw the fast-varying components, and they clearly show three successive peaks during ∼13:09−13:15 UT, suggesting a quasi-period of ∼120 s. The quasi-periods are confirmed by the Morlet wavelet power spectra in panels e and f. They both show an enhanced wavelet power during almost the same time. The bulk of two power spectra are centered at about 120 s, suggesting a dominant period of ∼120 s.
 |
Fig. 4. Wavelet analysis results for BP1. Top: normalized light curves (black) integrated between two lines (such as between green and cyan lines for a, between green and magenta lines for b) in Fig. 3a, and slow-varying components (green). Middle: rapidly-varying components. Bottom: Morlet wavelet spectra of the rapidly-varying components in panels (c) and (d), a significance level of 99% is outlined by the magenta line. |
The Morlet wavelet analysis is performed for the fast-varying component, which strongly depends on the cutoff threshold and might result into an artificial signal (Kupriyanova et al. 2010; Auchère et al. 2016). To unambiguously draw a conclusion about the quasi-periodicity, we further plot the Fourier power spectrum of the raw light curve with the Lomb-Scargle periodogram (Scargle 1982), as shown in Fig. 5. Similar to previous findings (Vaughan 2005; Kolotkov et al. 2018; Li et al. 2020; Li 2022), the Fourier power spectrum is dominated by a power law at the long-period range and a flat spectrum at the short-period end, as outlined by the cyan line. A peak at about 120 s is seen to exceed the 99% significance level, as indicated by the magenta arrow and line. Moreover, the 120 s-peak is far from the cutoff threshold, as marked by the vertical line. Those results demonstrate that the 120-s periodicity is not artificial. The similar quasi-period confirms that the bidirectional moving structures are symmetrical. In a word, the moving structures detected in this UBP (BP1) are characterized by bidirections, simultaneity, symmetry, and quasi-periodicity, similarly to what observed with the moving structures seen in CBPs (cf., Ning & Guo 2014; Li et al. 2016a). The diverging motions of bidirectional moving structures are also observed in other eight UBPs, as listed in Appendix A and Table 1.
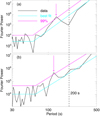 |
Fig. 5. Fourier power spectra of the raw light curves. The cyan line shows the best-fit result, and the magenta line represents the confidence level at 99%. The vertical dashed line mark the cutoff threshold of 200 s. |
Observational parameters of the analyzed UBPs.
3.2. Converging motions between the moving structures
In this case, we investigated a UBP (labeled “BP2”) showing converging motions between a pair of moving structures, as shown in Fig. 6. Different from the ‘BP1’, it firstly brightens at about 12:13:45 UT at two separated positions, which might be regarded as the two footpoints of a loop structure (cf., Mandal et al. 2021). Then they gradually move to their center position such as the loop top along a curved path between 12:14:00−12:14:45 UT. They finally merge together and exhibit a loop-like elongated shape, namely, at about 12:14:45 UT. The moving structures can be clearly seen in the running difference images, which are shown by pairs of white and dark kernels, as indicated by the yellow arrows.
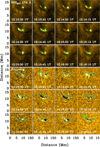 |
Fig. 6. Time sequence images with a small FOV of about 17 Mm × 17 Mm in the HRIEUV (top 12 panels) passband, and their running difference images (bottom 12 panels). The green contours represent the HRIEUV emission at the level of 900 DN s−1. Two cyan curves mark curved slits along the UBP, and the green symbol of ‘*’ indicate the zero of y-axis in Fig. 7. The yellow arrows indicate moving structures. |
Figure 7 presents time-distance slices in HRIEUV 174 Å (a) and its running difference images (b), as well as in HRILyα 1216 Å (c). This UBP begins to brighten at two different locations, that is, two footpoints. The maximum distance between the two footpoints is taken as the size of this UBP, which is about 5.5 Mm. Then, the brightenings at the two locations move closer and then merge into a single source at their center position, which may be regarded as the converging motion of bidirectional moving structures. The converging motions are repeated twice from about 12:13:15 UT to 12:16:45 UT, and the lifetime of this UBP is roughly equal to 3.5 min. The overplotted light curves in panel a are integrated over from the short green and cyan and megenta lines in the left panel. They both show double peaks, and appear almost simultaneously. However, it is not necessary to discuss the quasi-periodicity when there are only two peaks. Thus, we did not perform the wavelet analysis. In panel b, moving structures are identified as oblique streaks, they appear in pairs and show the converging motion, as indicated by the cyan and magenta arrows. Their average speeds are estimated to be about 50/72 km s−1. Panel c reveals a weak brightness distribution in Lyα 1216 Å, suggesting the UBP has a HRILyα counterpart. The converging motions of moving structures are also detected in other four UBPs, which are located in the quiet Sun region (for more, see the detailed in Appendix B and Table 1).
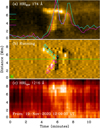 |
Fig. 7. Time-distance slices for BP2 made from SolO/EUI image series in the HRIEUV passband (a) and their derivative, shown as the gradient along the time axis (b), as well as the HRILyα passband (c), respectively. The cyan and magenta arrows indicate the converging motion of two moving structures. |
3.3. Sympathetic BP induced by the primary UBP
Here, the bidirectional moving structures are observed in the primary UBP (BP3) and the converging motion can be seen between the primary UBP and its sympathetic bright point (SBP). Figure 8 presents time sequence images, showing the temporal evolution of the UBP (labeled “BP3”). The top 12 panels give intensity images in HRIEUV 174 Å. Similarly to the BP1, the primary UBP starts with a bright patch, and it expands toward two opposite directions along a curved path. Then, a remote brightening appears at about 14:07:00 UT, which is linked to the primary UBP with a large loop-like structure, which could be regarded as the SBP (cf., Zhang & Ji 2013). After that, a portion of the primary UBP and the SBP move closely along the large loop-like path, showing a converging motion. The moving structures can be clearly seen in running difference images, as shown in the bottom 12 panels. They are divided into white and dark kernels, as indicated by the magenta (diverging motions) and yellow (converging motions) arrows.
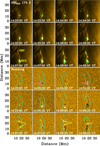 |
Fig. 8. Time sequence images with a small FOV of about 38 Mm × 38 Mm in the HRIEUV (top 12 panels) passband, and their running difference images (bottom 12 panels). The green contours represent the HRIEUV emission at the level of 1000 DN s−1. Two cyan curves mark curved slits along the UBP, and the green symbol of ‘*’ indicate the zero of y-axis in Fig. 7. The magenta and yellow arrows indicate moving structures. |
Figure 9 presents time-distance slices derived from the curved slits, as outlined by two cyan lines in Fig. 8. The primary UBP can be seen from about 14:01:00 UT to 14:09:00 UT in the intensity slice (panel a), which lasts for about 8.0 min. The maximal length of the bright emission is estimated to be about 11.2 Mm. We notice that only the size and lifetime of the primary UBP is considered here, because the SBP is much weaker than the primary UBP. The projected speeds are estimated from oblique streaks in the running difference slice, as shown in panel b. At first, the projected speeds are estimated to be about 77−85 km s−1, which are roughly equal. However, they vary only slightly when the SBP appears, such as 114 km s−1 and 143 km s−1. Similarly, the apparent speeds for converging motions are also different, namely: 136 km s−1 and 42 km s−1. The speed from the primary UBP (red arrow) is much faster than that coming from the SBP (blue arrow). Moreover, the evolution of the primary UBP and its SBP could be seen in Lyα 1216 Å, as shown in Fig. 9c, implying that they have HRILyα counterparts.
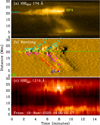 |
Fig. 9. Time-distance slices for BP3 made from SolO/EUI image series in the HRIEUV passband (a) and their derivative, shown as the gradient along the time axis (b), as well as the HRILyα passband (c), respectively. The color arrows indicate bidirectional moving structures. |
In order to take a closer look at the quasi-periodicity, the Morlet wavelet analysis method is applied to the primary UBP, as shown in Fig. 10. Panels a and b plots normalized light curves integrated over two nearly symmetrical regions. They both show several subpeaks, which could be regarded as quasi-periodic pulsations. Then, the raw light curves are decomposed into slow- (green) and fast- (panels c and d) varying components by using the FFT technique. Panels e and f present wavelet power spectra of fast-varying components, and they both show a broad range of periods but centered at about 80 s. This implies that bidirectional moving structures in the primary UBP are intermittent and quasi-periodic.
 |
Fig. 10. Wavelet analysis results for BP3. Top: normalized light curves (black) integrated between two lines (such as between green and cyan lines for a, between green and magenta lines for b) in Fig. 3a, and slow-varying components (green). Middle: rapidly-varying components. Bottom: Morlet wavelet spectra of the rapidly-varying components in panels c and d, a significance level of 99% is outlined by the magenta line. |
3.4. Chromospheric responses of UBPs
Figure 11 shows Lyα images with a zoomed FOV of about 150 Mm × 150 Mm at three points in time during the UBPs labeled as BP1−BP3. It can be seen that these three Lyα images exhibit chromospheric network structures and three UBPs are located on network boundaries, as outlined by the green diamonds. That is, when the UBP flash occurs in the HRIEUV passband, the Lyα emission in the chromosphere is also enhanced, for instance, showing the Lyα transient brightening. Similarly to what seen in Lyα images of these three UBPs, the other twelve UBPs are found to have Lyα brightenings and they appear to locate at the location of network boundaries, as shown in Figs. A.2 and B.2.
 |
Fig. 11. Snapshots with a zoomed FOV of about 150 Mm × 150 Mm in HRILyα1216 Å. The green diamonds mark the locations of three UBPs, respectively. The cyan tick indicates a spacing of 30 Mm on the Sun |
4. Conclusions and discussion
Based on high-spatial resolution datasets measured by SolO/EUI in passbands of HRIEUV and HRILyα, we explored moving structures in fifteen UBPs, both in the quiet-Sun region and in the AR. Two classes of moving structures have been found: (I) diverging motions of bidirectional moving structures are observed in ten UBPs; (II) converging motions between double moving structures are seen in five UBPs. Besides, we found a SBP that is induced by the primary UBP, and the converging motion along a large loop-like structure is found between their moving structures. The moving structures observed in UBPs seem to be similar to the propagating brightenings reported by Mandal et al. (2021). However, the merger-type event of propagating brightenings started at one footpoint and moved toward another footpoint, and their repeated plasma ejections showed a unidirectional motion (see Mandal et al. 2021). Our UBPs exhibit bidirectional movements originated from a bright core and propagate toward two ends, the converging motions begin simultaneously at two footpoints and moved toward the loop-top region. We do not find the reflected motion. This is mainly because that the EUI data used by Mandal et al. (2021) has nearly a factor of two higher spatial-resolutions and three higher cadences.
Using higher cadence observations from SolO/EUI, several groups of small-scale UV brightenings have been reported in the quiet-Sun region, namely, campfires (Berghmans et al. 2021), microjets (Hou et al. 2021), and fast repeating jets (Chitta et al. 2021b), et cetera. Campfires appear as transient UV brightenings, whereas they do not reveal apparently localized Lyα brightenings. Their length sizes are smaller than 4 Mm and their lifetimes are shorter than 200 s (Berghmans et al. 2021; Chen et al. 2021). Microjets are identified as collimated structures with bright emissions at footpoints and extended outward spires, some of them show pronounced signatures in the HRILyα passband. They have the maximum length scale of 7.7 Mm, an average duration of 4.6 min, and a projected speed of 62 km s−1 (Hou et al. 2021). Fast repeating jets show intermittent jet activities on a very short timescale with unidirection or bidirections, while their propagating speeds can be as fast as about 150 km s−1 (Chitta et al. 2021b). All those UV brightenings are transient in nature and they are proposed to have been generated by the small-scale magnetic reconnection and could contribute to the coronal heating, particularly in the quiet Sun (e.g., Chen et al. 2021; Panesar et al. 2021; Zhukov et al. 2021). In this study, we find that UBPs seem to have larger sizes for longer lifetimes, and more than one-third of them have duration below 240 s (Table 1). Campfires found by Berghmans et al. (2021) are limited by their short duration, and there are certainly many events with durations that are longer than 200 s. Thus, UBPs and campfires most likely share the similar magnetic origin, for instance, small-scale reconnection at coronal heights (Chen et al. 2021; Panesar et al. 2021). Our observations extend the distribution of small UV bright events, such as, UBPs, campfires, and so on. The length size and lifetime are roughly equal to that observed in microjets, but the microjet often shows the collimated outflow along an open magnetic field line (Hou et al. 2021). The bidirectional moving structures of UBPs are mostly confined in the closed magnetic loops, which are similar to fast repeating jets reported by Chitta et al. (2021b). However, those fast-repeating jets have very short lifetimes and quick speeds, mainly due to the much higher temporal resolution of EUI data. Our UBPs reveal bidirectional moving structures, whether they exhibit divergence or convergence. They all show obviously signatures in Lyα 1216 Å images and appear to locate on network boundaries, suggesting that they have responses both in the corona and chromosphere.
Bidirectional moving structures originated from the bright core have been investigated in two CBPs and a C-class flare at multiple wavelengths (Ning & Guo 2014; Ning 2016; Li et al. 2016a). They are characterized by bidirections, simultaneity, symmetry, and quasi-periodicity. Their apparent speeds are estimated to be about 200−300 km s−1. Both the two CBPs and the C-class flare were seen in big ARs. In our observation, three UBPs are detected inside (BP8 and BP10) or close to (BP3) a small AR. Thus, their length sizes, lifetimes and average apparent speeds are larger than those seven UBPs in the quiet-Sun region, as shown in Table 1. However, the fastest speed is only about 140 km s−1, which is still smaller than previous findings in AR CBPs (e.g., Ning & Guo 2014; Li et al. 2016a). This is might because that the AR in our case is small. The apparent speeds of seven UBPs in the quiet-Sun region are estimated to ∼33−85 km s−1, which are roughly equal to the projected speeds observed in microjets (Hou et al. 2021) and propagating brightenings (Mandal et al. 2021), implying their common origin. Previous observations suggest that these bidirectional moving structures could be regarded as outflows after the magnetic reconnection (Ning & Guo 2014; Li et al. 2016a; Tiwari et al. 2019; Ning et al. 2020); this is consistent with bidirectional plasma flows on a short timescale in fast-repeating jets (Chitta et al. 2021b). We notice that three UBPs (BP2, BP7, and BP9) do not reveal quasi-periodicity, largely due to their short lifetime and lower cadence in our data. In a future work, we will check the periodicity with high-cadence HRIEUV images (e.g., Chitta et al. 2021b; Mandal et al. 2021).
In this study, we also find bidirectional moving structures from two-end sources to their center region along loop-like paths in five UBPs, that is, converging motions between two moving structures. The classical 2D reconnection model suggests that both bidirectional inflows and outflows are generated by magnetic reconnection (Sturrock & Coppi 1964; Priest et al. 1994; Li 2019; Peter et al. 2019). Therefore, the converging motions could be considered as bidirectional inflows. Moreover, a SBP induced by the primary UBP (BP3) is seen at the periphery of a small AR, and they are moving closely along a large-scale loop path, merging together in the loop-top source. Such converging motion between a primary CBP and its SBP is regarded as the signature of chromosphere evaporation (see, Zhang & Ji 2013). Therefore, the converging motions between two moving structures might also be explained as upflows driven by the chromosphere evaporation. However, we cannot conclude the nature of their mechanism due to the lack of other observations, such as those based on magnetic fields, HXR sources, and spectral lines. And it is impossible to determine the locations of the footpoints and loop top, which are based solely on the shape and movement of UBPs (see also Mandal et al. 2021). For a more reliable conclusion, joint observations with other remote sensing instruments with high resolutions are required, for instance, the Polarimetric and Helioseismic Imager (Solanki et al. 2020), the Spectrometer/Telescope for Imaging X-rays (Krucker et al. 2020), and the Spectral Imaging of the Coronal Environment (Spice Consortium 2020) on board SolO.
Acknowledgments
We thank the referee for inspiring comments to improve the quality of this article. The author would like to appreciate Drs. D. Berghmans and F. Auchère for their kindly discussing about the SolO/EUI data. This study is supported by NSFC under grant 11973092, 12073081, U1931138, 11790302, the Strategic Priority Research Program on Space Science, CAS, Grant No. XDA15052200 and XDA15320301. D. Li is also supported by the Surface Project of Jiangsu Province (BK20211402). Solar Orbiter is a space mission of international collaboration between ESA and NASA, operated by ESA. The EUI instrument was built by CSL, IAS, MPS, MSSL/UCL, PMOD/WRC, ROB, LCF/IO with funding from the Belgian Federal Science Policy Office (BELSPO/PRODEX PEA 4000112292); the Centre National d’Etudes Spatiales (CNES); the UK Space Agency (UKSA); the Bundesministerium für Wirtschaft und Energie (BMWi) through the Deutsches Zentrum für Luft-und Raumfahrt (DLR) and the Swiss Space Office (SSO).
References
- Alexander, C. E., Del Zanna, G., & Maclean, R. C. 2011, A&A, 526, A134 [NASA ADS] [CrossRef] [EDP Sciences] [Google Scholar]
- Alipour, N., & Safari, H. 2015, ApJ, 807, 175 [NASA ADS] [CrossRef] [Google Scholar]
- Auchère, F., Froment, C., Bocchialini, K., et al. 2016, ApJ, 825, 110 [CrossRef] [Google Scholar]
- Berghmans, D., Auchère, F., Long, D. M., et al. 2021, A&A, 656, L4 [NASA ADS] [CrossRef] [EDP Sciences] [Google Scholar]
- Chae, J., Wang, H., Goode, P. R., et al. 2000, ApJ, 528, L119 [NASA ADS] [CrossRef] [Google Scholar]
- Chen, Y., Przybylski, D., Peter, H., et al. 2021, A&A, 656, L7 [NASA ADS] [CrossRef] [EDP Sciences] [Google Scholar]
- Cheng, X., Zhang, J., Ding, M. D., et al. 2013, ApJ, 769, L25 [NASA ADS] [CrossRef] [Google Scholar]
- Cheng, X., Zhang, J., Kliem, B., et al. 2020, ApJ, 894, 85 [Google Scholar]
- Chitta, L. P., Peter, H., & Young, P. R. 2021a, A&A, 647, A159 [NASA ADS] [CrossRef] [EDP Sciences] [Google Scholar]
- Chitta, L. P., Solanki, S. K., Peter, H., et al. 2021b, A&A, 656, L13 [NASA ADS] [CrossRef] [EDP Sciences] [Google Scholar]
- Galsgaard, K., Madjarska, M. S., Mackay, D. H., et al. 2019, A&A, 623, A78 [NASA ADS] [CrossRef] [EDP Sciences] [Google Scholar]
- Golub, L., Krieger, A. S., Silk, J. K., et al. 1974, ApJ, 189, L93 [NASA ADS] [CrossRef] [Google Scholar]
- Golub, L., Krieger, A. S., & Vaiana, G. S. 1976, Sol. Phys., 49, 79 [NASA ADS] [CrossRef] [Google Scholar]
- Golub, L., Krieger, A. S., Harvey, J. W., et al. 1977, Sol. Phys., 53, 111 [NASA ADS] [CrossRef] [Google Scholar]
- Habbal, S. R., & Withbroe, G. L. 1981, Sol. Phys., 69, 77 [Google Scholar]
- Habbal, S. R., Dowdy, J. F., & Withbroe, G. L. 1990, ApJ, 352, 333 [NASA ADS] [CrossRef] [Google Scholar]
- Hara, H., Watanabe, T., Harra, L. K., et al. 2011, ApJ, 741, 107 [NASA ADS] [CrossRef] [Google Scholar]
- Harvey, K. L., Strong, K. T., Nitta, N., et al. 1993, Adv. Space Res., 13, 27 [NASA ADS] [CrossRef] [Google Scholar]
- Hosseini Rad, S., Alipour, N., & Safari, H. 2021, ApJ, 906, 59 [NASA ADS] [CrossRef] [Google Scholar]
- Hou, Z., Tian, H., Berghmans, D., et al. 2021, ApJ, 918, L20 [NASA ADS] [CrossRef] [Google Scholar]
- Huang, Z., Madjarska, M. S., Xia, L., et al. 2014, ApJ, 797, 88 [Google Scholar]
- Huang, Z., Li, B., & Xia, L. 2019, Sol. Terr. Phys., 5, 58 [NASA ADS] [Google Scholar]
- Innes, D. E., Inhester, B., Axford, W. I., et al. 1997, Nature, 386, 811 [Google Scholar]
- Innes, D. E., Guo, L.-J., Huang, Y.-M., et al. 2015, ApJ, 813, 86 [NASA ADS] [CrossRef] [Google Scholar]
- Jiang, Y., Bi, Y., Yang, J., et al. 2013, ApJ, 775, 132 [NASA ADS] [CrossRef] [Google Scholar]
- Kolotkov, D. Y., Pugh, C. E., Broomhall, A.-M., et al. 2018, ApJ, 858, L3 [NASA ADS] [CrossRef] [Google Scholar]
- Kupriyanova, E. G., Melnikov, V. F., Nakariakov, V. M., et al. 2010, Sol. Phys., 267, 329 [NASA ADS] [CrossRef] [Google Scholar]
- Krucker, S., Hurford, G. J., Grimm, O., et al. 2020, A&A, 642, A15 [NASA ADS] [CrossRef] [EDP Sciences] [Google Scholar]
- Li, D. 2019, Res. Astron. Astrophys., 19, 067 [Google Scholar]
- Li, D. 2022, Sci. China Technol. Sci., 65, 139 [Google Scholar]
- Li, D., & Ning, Z. 2012, Ap&SS, 341, 215 [NASA ADS] [CrossRef] [Google Scholar]
- Li, D., Ning, Z. J., & Wang, J. F. 2013, New Astron., 23, 19 [CrossRef] [Google Scholar]
- Li, D., Ning, Z., & Su, Y. 2016a, Ap&SS, 361, 301 [NASA ADS] [CrossRef] [Google Scholar]
- Li, L., Zhang, J., Peter, H., et al. 2016b, Nat. Phys., 12, 847 [Google Scholar]
- Li, D., Li, L., & Ning, Z. 2018, MNRAS, 479, 2382 [Google Scholar]
- Li, D., Kolotkov, D. Y., Nakariakov, V. M., et al. 2020, ApJ, 888, 53 [Google Scholar]
- Li, D., Ge, M., Dominique, M., et al. 2021, ApJ, 921, 179 [NASA ADS] [CrossRef] [Google Scholar]
- Lin, J., Ko, Y.-K., Sui, L., et al. 2005, ApJ, 622, 1251 [NASA ADS] [CrossRef] [Google Scholar]
- Liu, W., Chen, Q., & Petrosian, V. 2013, ApJ, 767, 168 [NASA ADS] [CrossRef] [Google Scholar]
- Madjarska, M. S. 2019, Liv. Rev. Sol. Phys., 16, 2 [Google Scholar]
- Mandal, S., Peter, H., Chitta, L. P., et al. 2021, A&A, 656, L16 [NASA ADS] [CrossRef] [EDP Sciences] [Google Scholar]
- Mou, C., Huang, Z., Xia, L., et al. 2016, ApJ, 818, 9 [Google Scholar]
- Mou, C., Madjarska, M. S., Galsgaard, K., et al. 2018, A&A, 619, A55 [NASA ADS] [CrossRef] [EDP Sciences] [Google Scholar]
- Müller, D., St. Cyr, O.C., Zouganelis, I., et al. 2020, A&A, 642, A1 [NASA ADS] [CrossRef] [EDP Sciences] [Google Scholar]
- Nakariakov, V. M., Kolotkov, D. Y., Kupriyanova, E. G., et al. 2019, Plasma Phys. Control. Fusion, 61 [Google Scholar]
- Ning, Z. 2016, Ap&SS, 361, 22 [NASA ADS] [CrossRef] [Google Scholar]
- Ning, Z. 2017, Sol. Phys., 292, 11 [Google Scholar]
- Ning, Z., & Guo, Y. 2014, ApJ, 794, 79 [Google Scholar]
- Ning, Z.-J., Li, D., & Zhang, Q.-M. 2020, Res. Astron. Astrophys., 20, 138 [Google Scholar]
- Panesar, N. K., Tiwari, S. K., Berghmans, D., et al. 2021, ApJ, 921, L20 [CrossRef] [Google Scholar]
- Peter, H., Tian, H., Curdt, W., et al. 2014, Science, 346, 1255726 [Google Scholar]
- Peter, H., Huang, Y.-M., Chitta, L. P., et al. 2019, A&A, 628, A8 [NASA ADS] [CrossRef] [EDP Sciences] [Google Scholar]
- Priest, E. R., & Forbes, T. G. 2002, A&ARv, 10, 313 [Google Scholar]
- Priest, E. R., Parnell, C. E., & Martin, S. F. 1994, ApJ, 427, 459 [Google Scholar]
- Rochus, P., Auchère, F., Berghmans, D., et al. 2020, A&A, 642, A8 [NASA ADS] [CrossRef] [EDP Sciences] [Google Scholar]
- Samanta, T., Banerjee, D., & Tian, H. 2015, ApJ, 806, 172 [NASA ADS] [CrossRef] [Google Scholar]
- Scargle, J. D. 1982, ApJ, 263, 835 [Google Scholar]
- Shokri, Z., Alipour, N., Safari, H., et al. 2022, ApJ, 926, 42 [NASA ADS] [CrossRef] [Google Scholar]
- Shen, Y. 2021, Proc. R. Soc. Lond. Ser. A, 477, 217 [NASA ADS] [Google Scholar]
- Shibata, K., Nakamura, T., Matsumoto, T., et al. 2007, Science, 318, 1591 [Google Scholar]
- Solanki, S. K., del Toro Iniesta, J. C., Woch, J., et al. 2020, A&A, 642, A11 [NASA ADS] [CrossRef] [EDP Sciences] [Google Scholar]
- Spice Consortium (Anderson, M., et al.) 2020, A&A, 642, A14 [NASA ADS] [CrossRef] [EDP Sciences] [Google Scholar]
- Sturrock, P. A., & Coppi, B. 1964, Nature, 204, 61 [NASA ADS] [CrossRef] [Google Scholar]
- Su, Y., Veronig, A. M., Holman, G. D., et al. 2013, Nat. Phys., 9, 489 [Google Scholar]
- Sun, X., Hoeksema, J. T., Liu, Y., et al. 2012, ApJ, 757, 149 [NASA ADS] [CrossRef] [Google Scholar]
- Subramanian, S., Madjarska, M. S., Maclean, R. C., et al. 2008, A&A, 488, 323 [NASA ADS] [CrossRef] [EDP Sciences] [Google Scholar]
- Tian, H., Tu, C.-Y., He, J.-S., et al. 2007, Adv. Space Res., 39, 1853 [NASA ADS] [CrossRef] [Google Scholar]
- Tian, H., Xia, L.-D., & Li, S. 2008, A&A, 489, 741 [NASA ADS] [CrossRef] [EDP Sciences] [Google Scholar]
- Tian, H., DeLuca, E. E., Cranmer, S. R., et al. 2014, Science, 346, 1255711 [Google Scholar]
- Tian, H., Harra, L., Baker, D., et al. 2021, Sol. Phys., 296, 47 [NASA ADS] [CrossRef] [Google Scholar]
- Tiwari, S. K., Panesar, N. K., Moore, R. L., et al. 2019, ApJ, 887, 56 [NASA ADS] [CrossRef] [Google Scholar]
- Torrence, C., & Compo, G. P. 1998, Bull. Am. Meteorol. Soc., 79, 61 [Google Scholar]
- Ueda, K., Kano, R., Tsuneta, S., et al. 2010, Sol. Phys., 261, 77 [NASA ADS] [CrossRef] [Google Scholar]
- Vaughan, S. 2005, A&A, 431, 391 [NASA ADS] [CrossRef] [EDP Sciences] [Google Scholar]
- Yan, X., Liu, Z., Zhang, J., et al. 2020, Sci. China E: Technol. Sci., 63, 1656 [Google Scholar]
- Young, P. R., Tian, H., Peter, H., et al. 2018, Space Sci. Rev., 214, 120 [Google Scholar]
- Yokoyama, T., & Shibata, K. 1995, Nature, 375, 42 [Google Scholar]
- Zimovets, I. V., McLaughlin, J. A., Srivastava, A. K., et al. 2021, Space Sci. Rev., 217, 66 [NASA ADS] [CrossRef] [Google Scholar]
- Zhang, Q. M., & Ji, H. S. 2013, A&A, 557, L5 [NASA ADS] [CrossRef] [EDP Sciences] [Google Scholar]
- Zhang, J., Kundu, M. R., & White, S. M. 2001, Sol. Phys., 198, 347 [NASA ADS] [CrossRef] [Google Scholar]
- Zhang, Q. M., Chen, P. F., Guo, Y., et al. 2012, ApJ, 746, 19 [Google Scholar]
- Zhang, Q. M., Chen, P. F., Ding, M. D., et al. 2014, A&A, 568, A30 [NASA ADS] [CrossRef] [EDP Sciences] [Google Scholar]
- Zhukov, A. N., Mierla, M., Auchère, F., et al. 2021, A&A, 656, A35 [NASA ADS] [CrossRef] [EDP Sciences] [Google Scholar]
Appendix A: Diverging motions of bidirectional moving structures
In this section, we show eight UBPs that clearly exhibit bidirectional moving structures originated from a bright core and propagated toward two ends. Figures A.1 and A.2 plot snapshots of the BP4−BP11 in passbands of HRIEUV and HRILyα, respectively. Two cyan curves outline the slit positions, while the green diamonds mark UBP locations. Figures A.3 and A.4 draw time-distance slices for these UBPs derived from the EUV 174 Å intensity and their running difference images, respectively. The projected speeds are also labeled.
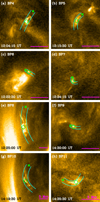 |
Fig. A.1. Snapshots with a small FOV in the HRIEUV passband. The FOV is about 14 Mm × 14 Mm for BP4−BP7, BP9, and BP11, while the FOV is about 28 Mm × 28 Mm for BP8 and BP10. Two cyan lines outline the curved slits, and the green ‘*’ indicates the start point. The green diamonds mark UBP locations. The magenta tick indicates a space of 5 Mm on the Sun. |
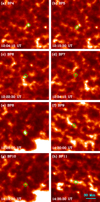 |
Fig. A.2. Snapshots with a zoomed FOV of about 150 Mm × 150 Mm in the HRILyα passband for BP4−BP11. The green diamonds mark UBP locations as shown in Fig. A.1. The cyan tick indicates a space of 30 Mm on the Sun |
 |
Fig. A.3. Time-distance slices for BP4−BP11 in the HRIEUV passband. |
 |
Fig. A.4. Derivative of time-distance slices in Fig. A.3. The color arrows indicate moving structures. |
Appendix B: Converging motions between two moving structures
In this section, we show four UBPs that clearly exhibit converging motions from two-end locations to their center regions. Figures B.1 and B.2 plot snapshots of the BP12−BP15 in passbands of HRIEUV and HRILyα, respectively. Two cyan curves outline slit positions, and the green diamonds mark UBP locations. Figure B.3 plots time-distance slices for these UBPs derived from the EUV 174 intensity and their running difference images, respectively. The apparent speeds are also shown.
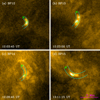 |
Fig. B.1. Snapshots with a same FOV of about 14 Mm × 14 Mm for BP12−BP15 in the HRIEUV passband. Two cyan curves outline slit positions, and the green ‘*’ indicates the start point. The magenta tick indicates a space of 5 Mm on the Sun. |
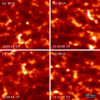 |
Fig. B.2. Snapshots with a zoomed FOV of about 150 Mm × 150 Mm in the HRILyα passband for BP12−BP15. The green diamonds mark UBP locations as shown in Fig. B.1. The cyan tick indicates a space of 30 Mm on the Sun. |
 |
Fig. B.3. Time-distance slices for BP12−BP15 in the HRIEUV passband (left) and their gradients along the time axis (right). The color arrows indicate converging motions. |
All Tables
All Figures
 |
Fig. 1. Snapshots in HRIEUV (a) and HRILyα (b) passbands measured by SolO/EUI. Fifteen UBPs are marked by numbers, while cyan circles ( |
| In the text | |
 |
Fig. 2. Time sequence images with a small FOV of about 24 Mm × 24 Mm in HRIEUV (top 12 panels) and HRILyα (middle 12 panels) passbands, and running difference images (bottom 12 panels) in the HRIEUV passband. The green contours represent the HRIEUV emission at the level of 1000 DN s−1. Two cyan curves mark the curved slits along the UBP, and the green symbol of ‘*’ indicate the zero of y-axis in Fig. 3. The magenta arrows outline moving structures. |
| In the text | |
 |
Fig. 3. Time-distance slices for BP1 derived from SolO/EUI image series in the HRIEUV passband (a) and its derivative (b), as well as the HRILyα passband (c), respectively. The green line indicates the UBP core, and the cyan and magenta lines outline the boundaries of the integrated flux in Fig. 4. The cyan and magenta arrows indicate bidirectional moving structures. |
| In the text | |
 |
Fig. 4. Wavelet analysis results for BP1. Top: normalized light curves (black) integrated between two lines (such as between green and cyan lines for a, between green and magenta lines for b) in Fig. 3a, and slow-varying components (green). Middle: rapidly-varying components. Bottom: Morlet wavelet spectra of the rapidly-varying components in panels (c) and (d), a significance level of 99% is outlined by the magenta line. |
| In the text | |
 |
Fig. 5. Fourier power spectra of the raw light curves. The cyan line shows the best-fit result, and the magenta line represents the confidence level at 99%. The vertical dashed line mark the cutoff threshold of 200 s. |
| In the text | |
 |
Fig. 6. Time sequence images with a small FOV of about 17 Mm × 17 Mm in the HRIEUV (top 12 panels) passband, and their running difference images (bottom 12 panels). The green contours represent the HRIEUV emission at the level of 900 DN s−1. Two cyan curves mark curved slits along the UBP, and the green symbol of ‘*’ indicate the zero of y-axis in Fig. 7. The yellow arrows indicate moving structures. |
| In the text | |
 |
Fig. 7. Time-distance slices for BP2 made from SolO/EUI image series in the HRIEUV passband (a) and their derivative, shown as the gradient along the time axis (b), as well as the HRILyα passband (c), respectively. The cyan and magenta arrows indicate the converging motion of two moving structures. |
| In the text | |
 |
Fig. 8. Time sequence images with a small FOV of about 38 Mm × 38 Mm in the HRIEUV (top 12 panels) passband, and their running difference images (bottom 12 panels). The green contours represent the HRIEUV emission at the level of 1000 DN s−1. Two cyan curves mark curved slits along the UBP, and the green symbol of ‘*’ indicate the zero of y-axis in Fig. 7. The magenta and yellow arrows indicate moving structures. |
| In the text | |
 |
Fig. 9. Time-distance slices for BP3 made from SolO/EUI image series in the HRIEUV passband (a) and their derivative, shown as the gradient along the time axis (b), as well as the HRILyα passband (c), respectively. The color arrows indicate bidirectional moving structures. |
| In the text | |
 |
Fig. 10. Wavelet analysis results for BP3. Top: normalized light curves (black) integrated between two lines (such as between green and cyan lines for a, between green and magenta lines for b) in Fig. 3a, and slow-varying components (green). Middle: rapidly-varying components. Bottom: Morlet wavelet spectra of the rapidly-varying components in panels c and d, a significance level of 99% is outlined by the magenta line. |
| In the text | |
 |
Fig. 11. Snapshots with a zoomed FOV of about 150 Mm × 150 Mm in HRILyα1216 Å. The green diamonds mark the locations of three UBPs, respectively. The cyan tick indicates a spacing of 30 Mm on the Sun |
| In the text | |
 |
Fig. A.1. Snapshots with a small FOV in the HRIEUV passband. The FOV is about 14 Mm × 14 Mm for BP4−BP7, BP9, and BP11, while the FOV is about 28 Mm × 28 Mm for BP8 and BP10. Two cyan lines outline the curved slits, and the green ‘*’ indicates the start point. The green diamonds mark UBP locations. The magenta tick indicates a space of 5 Mm on the Sun. |
| In the text | |
 |
Fig. A.2. Snapshots with a zoomed FOV of about 150 Mm × 150 Mm in the HRILyα passband for BP4−BP11. The green diamonds mark UBP locations as shown in Fig. A.1. The cyan tick indicates a space of 30 Mm on the Sun |
| In the text | |
 |
Fig. A.3. Time-distance slices for BP4−BP11 in the HRIEUV passband. |
| In the text | |
 |
Fig. A.4. Derivative of time-distance slices in Fig. A.3. The color arrows indicate moving structures. |
| In the text | |
 |
Fig. B.1. Snapshots with a same FOV of about 14 Mm × 14 Mm for BP12−BP15 in the HRIEUV passband. Two cyan curves outline slit positions, and the green ‘*’ indicates the start point. The magenta tick indicates a space of 5 Mm on the Sun. |
| In the text | |
 |
Fig. B.2. Snapshots with a zoomed FOV of about 150 Mm × 150 Mm in the HRILyα passband for BP12−BP15. The green diamonds mark UBP locations as shown in Fig. B.1. The cyan tick indicates a space of 30 Mm on the Sun. |
| In the text | |
 |
Fig. B.3. Time-distance slices for BP12−BP15 in the HRIEUV passband (left) and their gradients along the time axis (right). The color arrows indicate converging motions. |
| In the text | |
Current usage metrics show cumulative count of Article Views (full-text article views including HTML views, PDF and ePub downloads, according to the available data) and Abstracts Views on Vision4Press platform.
Data correspond to usage on the plateform after 2015. The current usage metrics is available 48-96 hours after online publication and is updated daily on week days.
Initial download of the metrics may take a while.


 ), red stars (
 ), and magenta diamonds (
 ) outline their locations in three data sets, respectively.