Fig. 10.
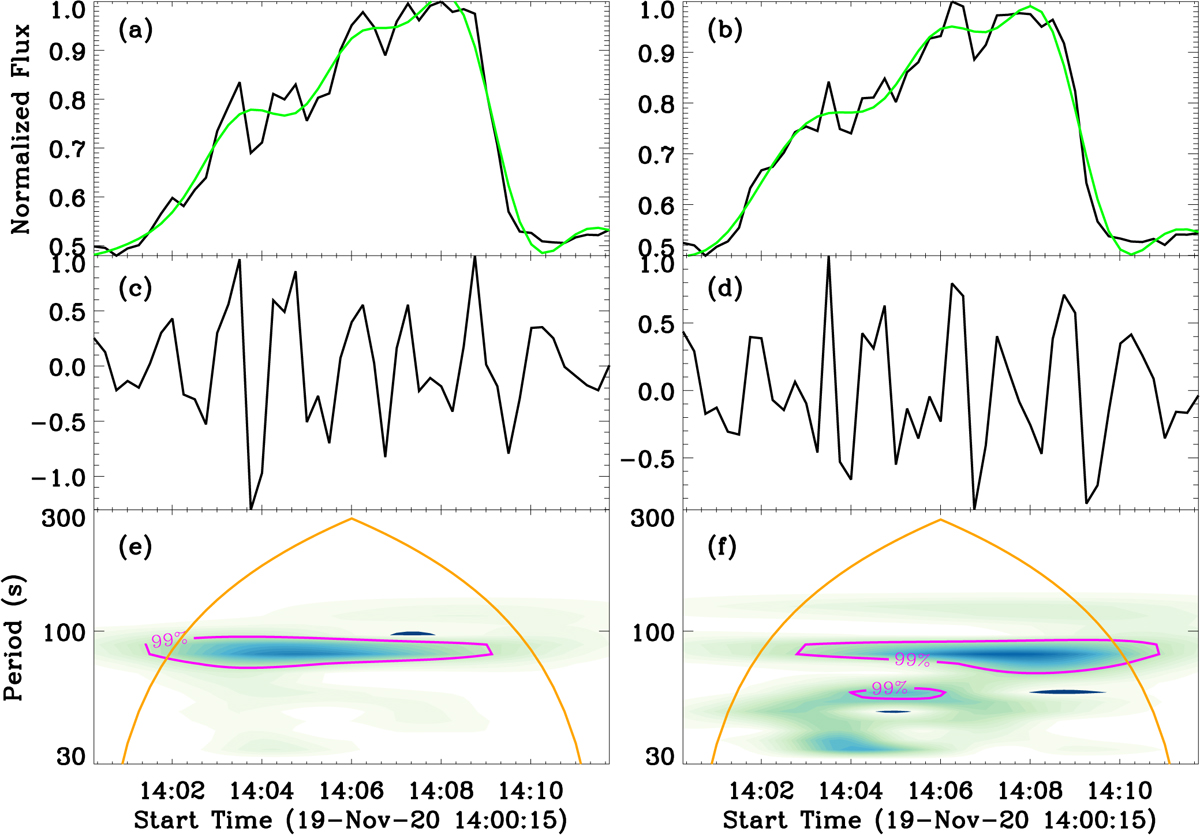
Download original image
Wavelet analysis results for BP3. Top: normalized light curves (black) integrated between two lines (such as between green and cyan lines for a, between green and magenta lines for b) in Fig. 3a, and slow-varying components (green). Middle: rapidly-varying components. Bottom: Morlet wavelet spectra of the rapidly-varying components in panels c and d, a significance level of 99% is outlined by the magenta line.
Current usage metrics show cumulative count of Article Views (full-text article views including HTML views, PDF and ePub downloads, according to the available data) and Abstracts Views on Vision4Press platform.
Data correspond to usage on the plateform after 2015. The current usage metrics is available 48-96 hours after online publication and is updated daily on week days.
Initial download of the metrics may take a while.