Fig. 2.
Download original image
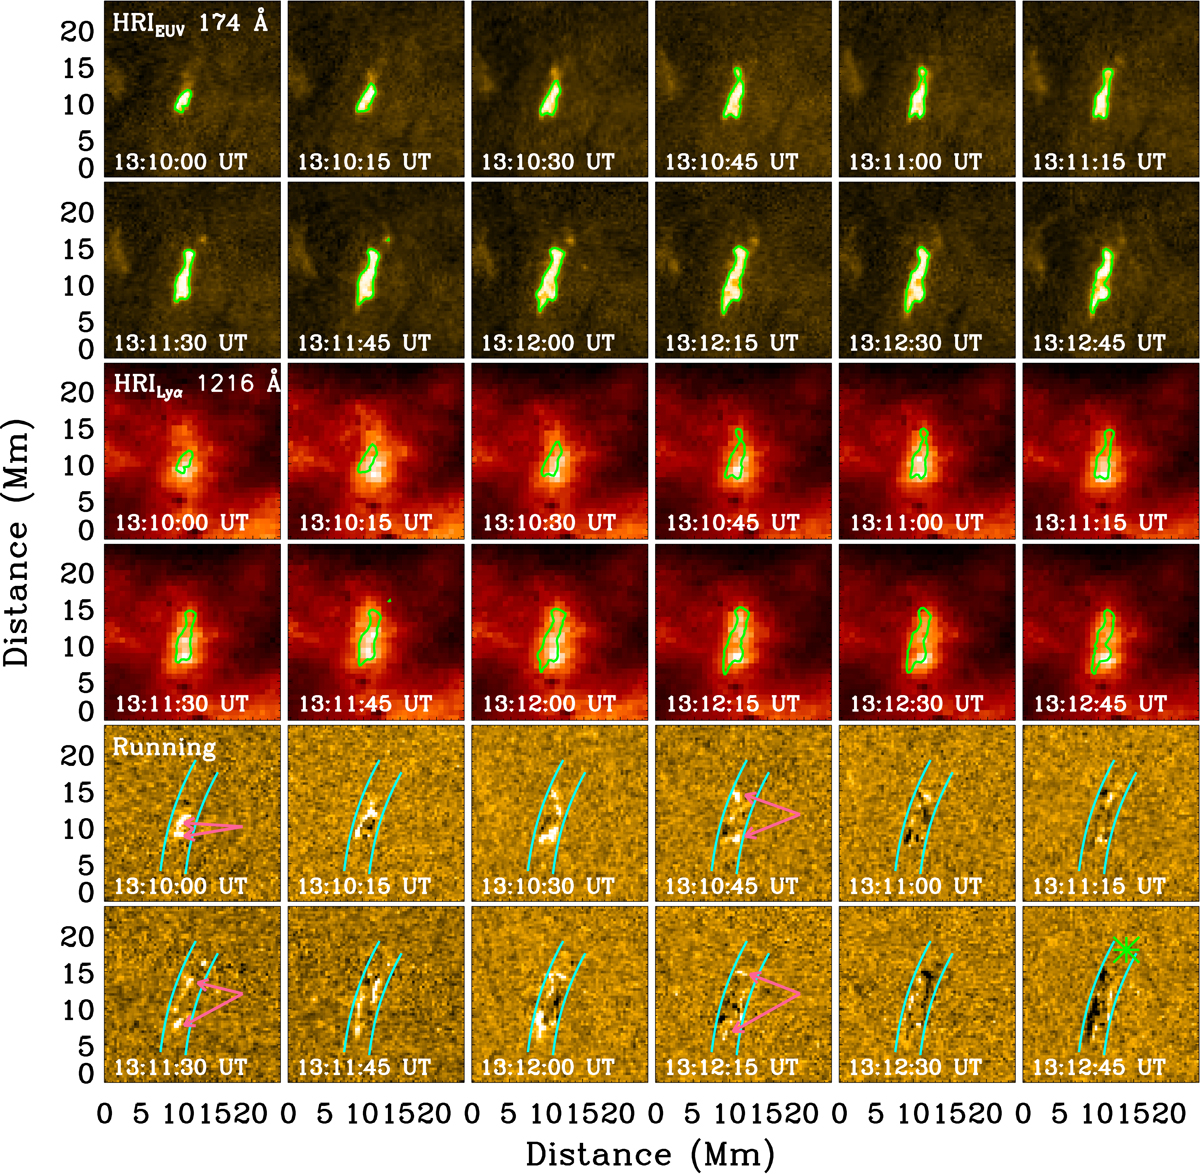
Time sequence images with a small FOV of about 24 Mm × 24 Mm in HRIEUV (top 12 panels) and HRILyα (middle 12 panels) passbands, and running difference images (bottom 12 panels) in the HRIEUV passband. The green contours represent the HRIEUV emission at the level of 1000 DN s−1. Two cyan curves mark the curved slits along the UBP, and the green symbol of ‘*’ indicate the zero of y-axis in Fig. 3. The magenta arrows outline moving structures.
Current usage metrics show cumulative count of Article Views (full-text article views including HTML views, PDF and ePub downloads, according to the available data) and Abstracts Views on Vision4Press platform.
Data correspond to usage on the plateform after 2015. The current usage metrics is available 48-96 hours after online publication and is updated daily on week days.
Initial download of the metrics may take a while.