Fig. 7.

Download original image
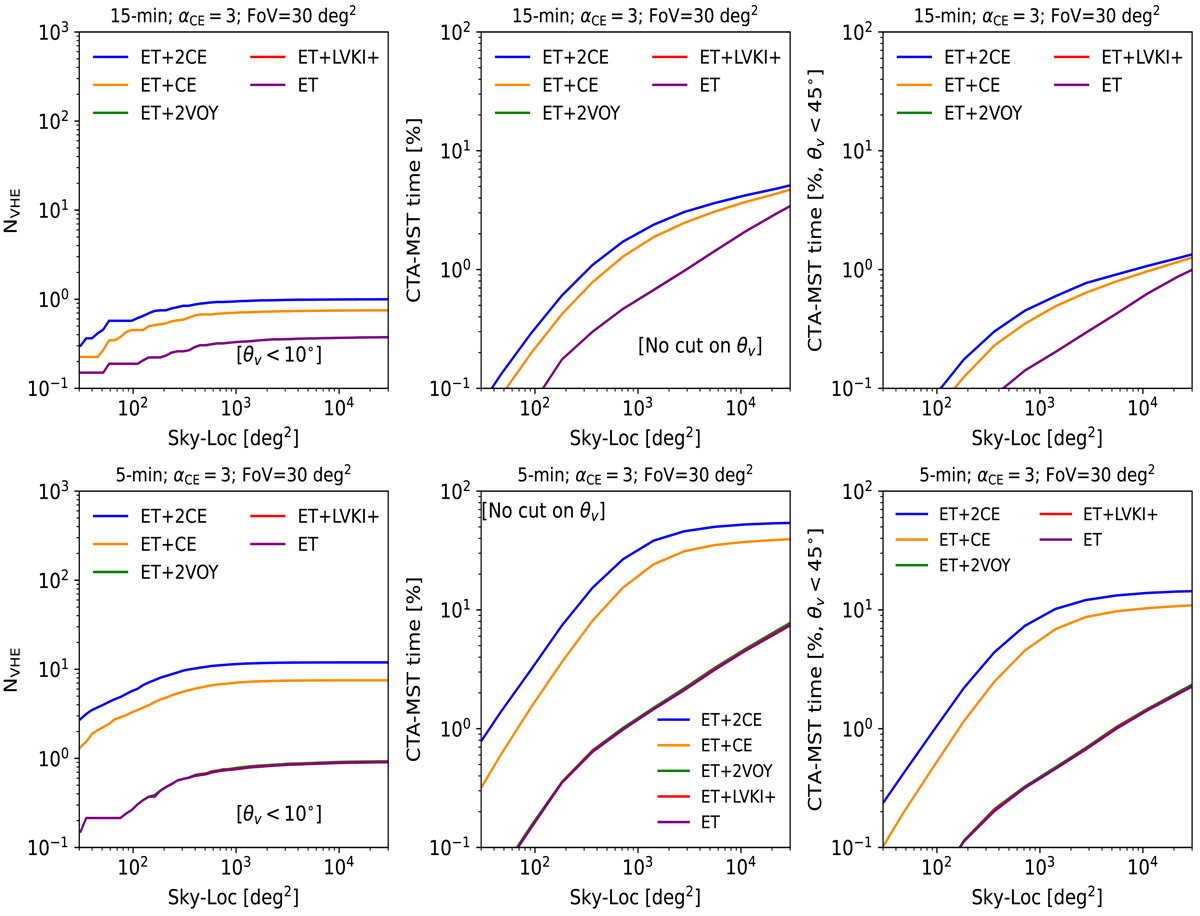
Expected number of detections by CTA-MST using the one-shot observation strategy (left column). The estimates of the number of possible VHE counterparts are based on the on-axis BNS systems (systems injected with θv < 10° in our simulations) and are evaluated as described in the text (see Eq. (6)). These estimates assume that all BNS produce a jet. They take into account the sky-localization (Ωi) of each event, the MST field of view of 30 deg2, the CTA duty cycle of 15%, and the CTA visibility limited to a zenith angle larger than 60° (minimum elevation of 30°). The fraction of CTA time spent following all the GW alerts with the sky-localization smaller than the one indicated on the x-axis is given by the plots in the central column. To observe each event (independent of the sky-localization) the observational time (tobs) is considered, given by the sum of slewing time (tslew = 90 s), an additional re-positioning time (trep = 10 s), and the exposure time (texp = 20 s). The plots in the right column show the CTA time when only triggers with an observed θv < 45° are followed up resulting in a significant reduction of CTA time.
Current usage metrics show cumulative count of Article Views (full-text article views including HTML views, PDF and ePub downloads, according to the available data) and Abstracts Views on Vision4Press platform.
Data correspond to usage on the plateform after 2015. The current usage metrics is available 48-96 hours after online publication and is updated daily on week days.
Initial download of the metrics may take a while.


