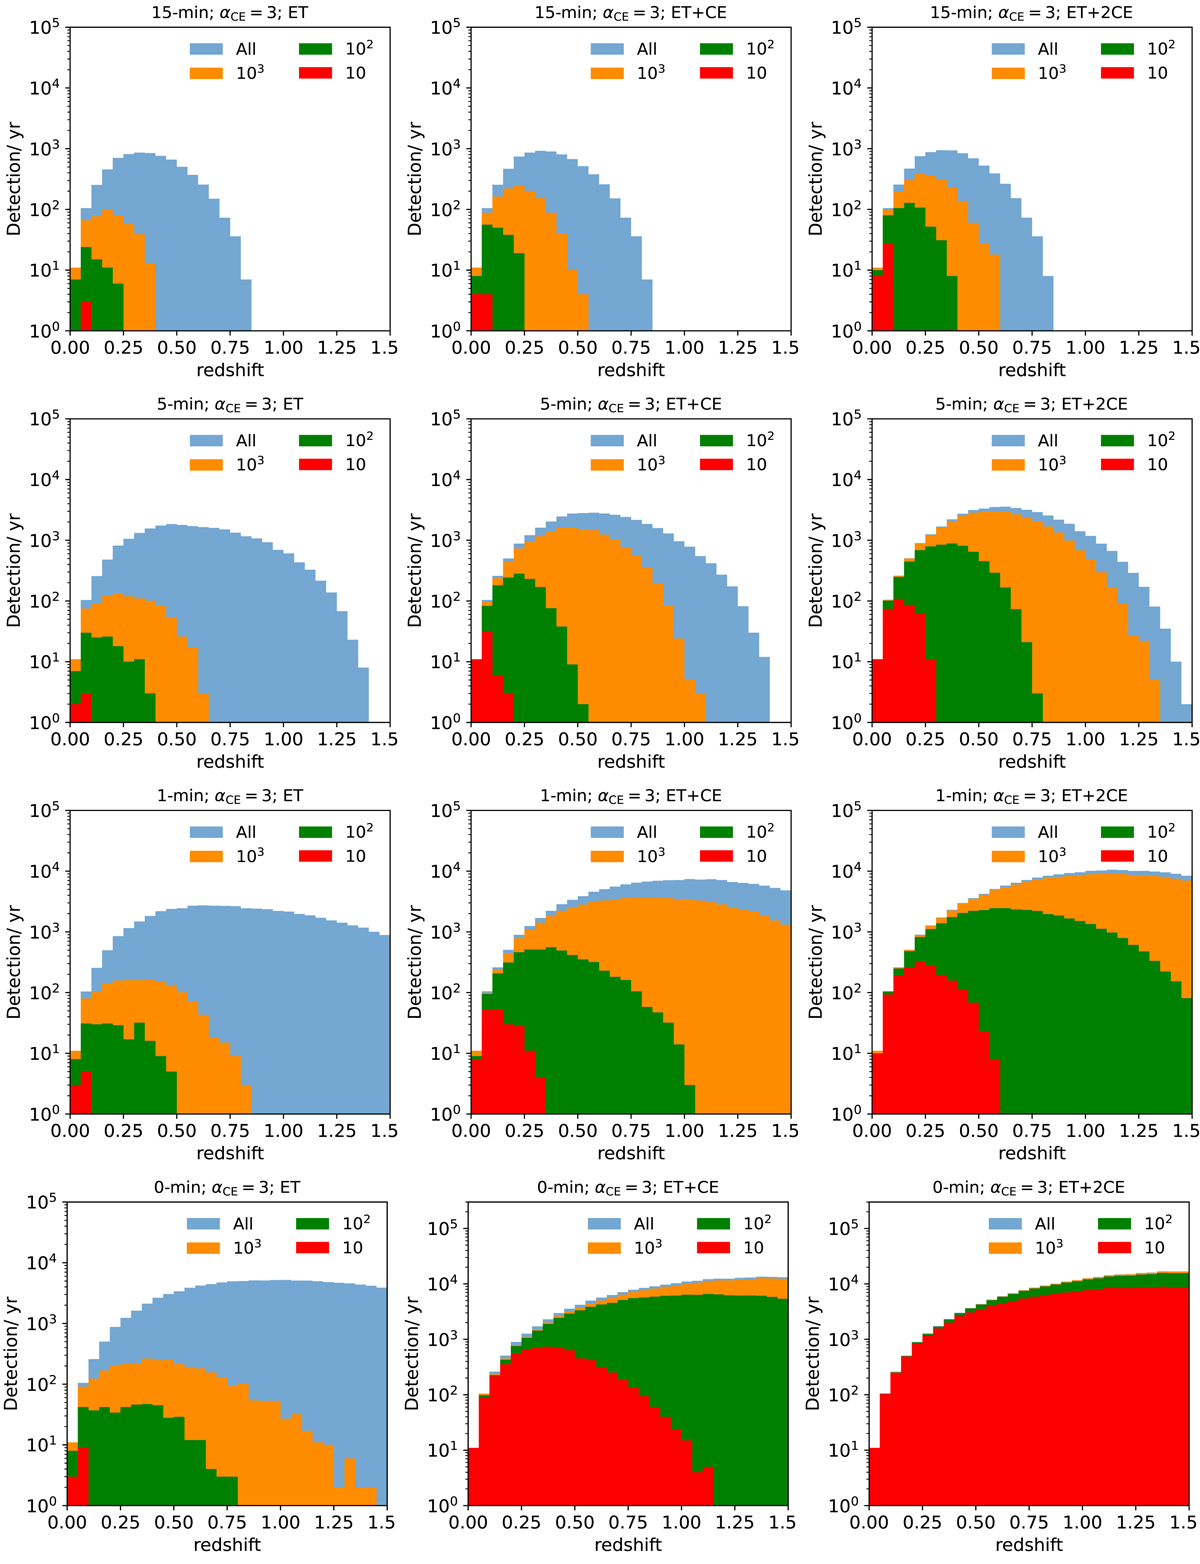
Fig. 6.
Download original image
Redshift distribution of sky-localization uncertainty (given as 90% credible region) for three detector configurations: ET, ET+CE, and ET+2CE. The absolute numbers refer to the fiducial BNS population sample and detections within a redshift of 1.5 per year of observation assuming a duty cycle of 0.85 (see text). The panels show the detections and the corresponding sky-localizations as a function of the redshift 15, 5, and 1 min before the merger and at the merger time. The blue histogram (“All”) shows all the detected sources.
Current usage metrics show cumulative count of Article Views (full-text article views including HTML views, PDF and ePub downloads, according to the available data) and Abstracts Views on Vision4Press platform.
Data correspond to usage on the plateform after 2015. The current usage metrics is available 48-96 hours after online publication and is updated daily on week days.
Initial download of the metrics may take a while.