Fig. 5.
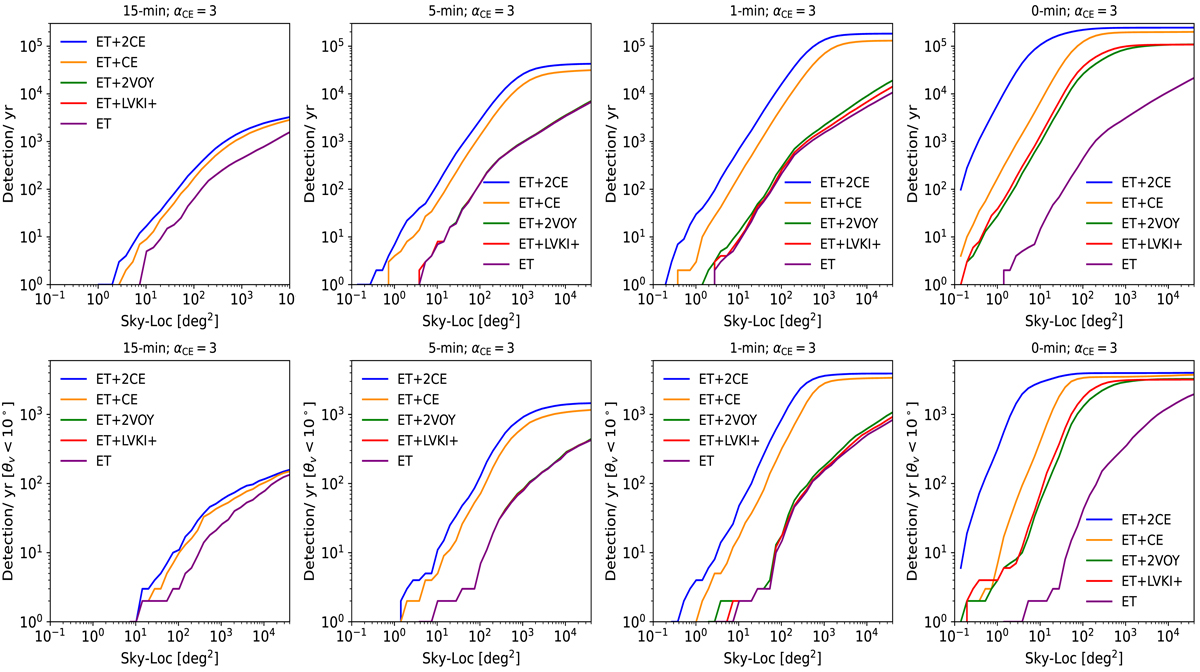
Download original image
Cumulative number of detections (S/N > 8) per year for different networks of GW detectors considering 15, 5, and 1 min before the merger and at the merger time. The top panels show the detections considering BNS systems with all orientations. The bottom panels show the detections of BNS systems with a viewing angle smaller than 10° (on-axis events), a fraction of which are expected to produce detectable VHE emissions. For each of the simulations, the injected BNSs are within redshift z = 1.5. The quoted detection numbers refer to the fiducial population and are obtained assuming a duty cycle of 0.85 (see text). For the 15 and 5 min pre-merger scenarios, the ET+LVKI+ and ET+2VOY do not show any significant difference with respect to ET as a single observatory (the red and green lines lie under the purple line).
Current usage metrics show cumulative count of Article Views (full-text article views including HTML views, PDF and ePub downloads, according to the available data) and Abstracts Views on Vision4Press platform.
Data correspond to usage on the plateform after 2015. The current usage metrics is available 48-96 hours after online publication and is updated daily on week days.
Initial download of the metrics may take a while.