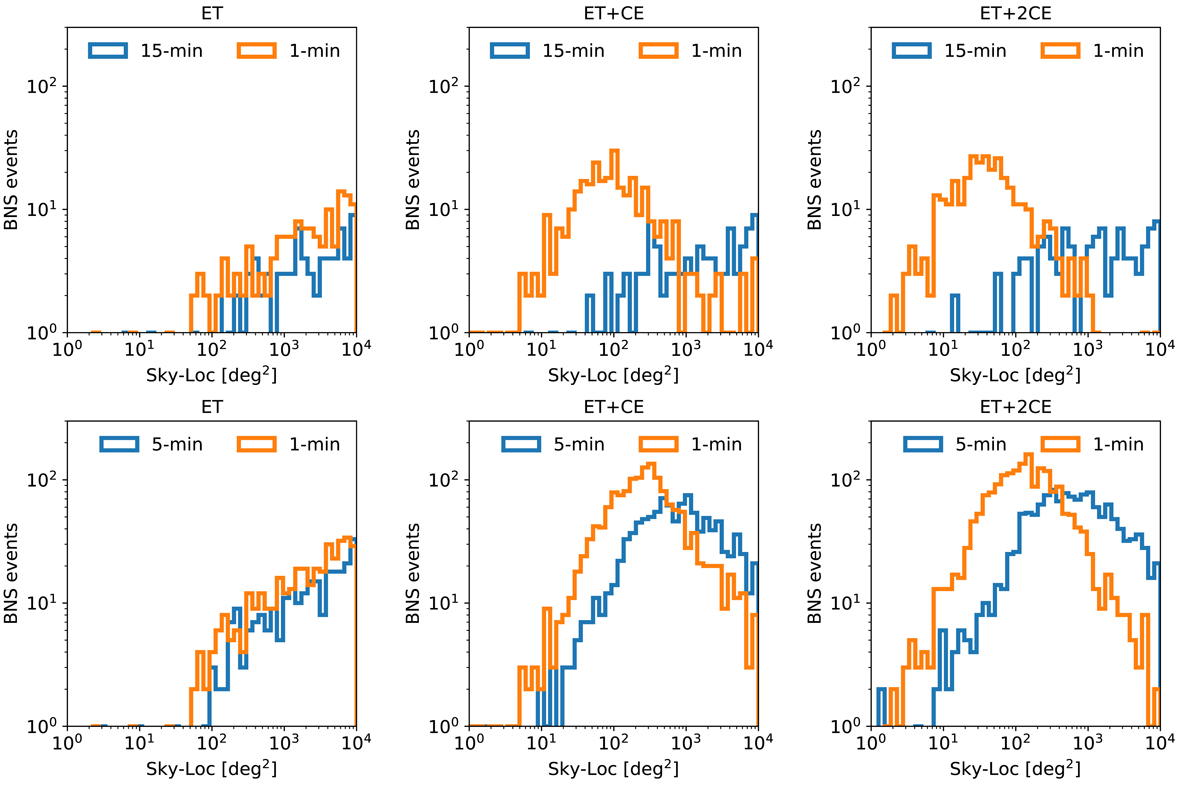
Fig. C.1.
Download original image
Improvement in sky-localization estimates closer to merger time. The blue histograms in the top panels show the sky-localizations obtained 15 min before the merger and in the bottom panels 5 min before the merger. The 1 min (orange) histograms show the sky-localization estimates for the same events. Re-positioning CTA within the updated (smaller) sky-localization released 1 min before the merger increases the chance of VHE detection.
Current usage metrics show cumulative count of Article Views (full-text article views including HTML views, PDF and ePub downloads, according to the available data) and Abstracts Views on Vision4Press platform.
Data correspond to usage on the plateform after 2015. The current usage metrics is available 48-96 hours after online publication and is updated daily on week days.
Initial download of the metrics may take a while.