Fig. B.1.
Download original image
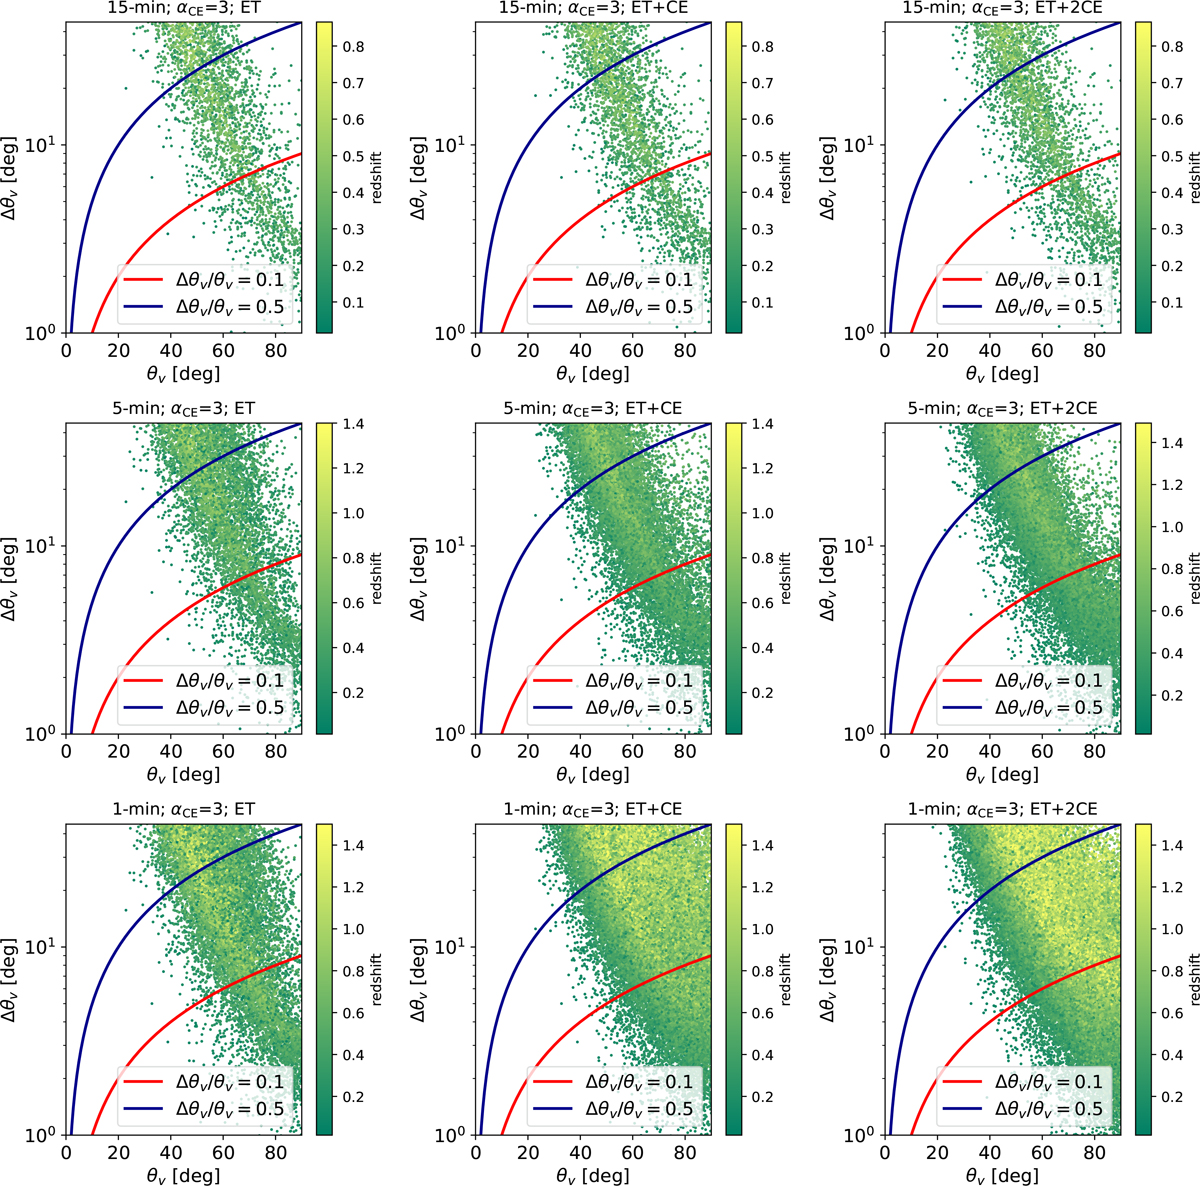
Distribution of uncertainties on viewing angle (Δθv) as estimated by GWFish vs injected θv of our fiducial population of BNS mergers for different detector configurations (ET, ET+CE, and ET+2CE) and for different pre-merger alert times (15 min, 5 min, 1 min) and at the time of the merger. The solid lines correspond to Δθv/θv = 0.1 and 0.5. The vertical color bar indicates the redshift of each event. The plots show only the BNS mergers below redshift 1.5. The uncertainty on the viewing angle, Δθv, is larger in the case of on-axis events.
Current usage metrics show cumulative count of Article Views (full-text article views including HTML views, PDF and ePub downloads, according to the available data) and Abstracts Views on Vision4Press platform.
Data correspond to usage on the plateform after 2015. The current usage metrics is available 48-96 hours after online publication and is updated daily on week days.
Initial download of the metrics may take a while.