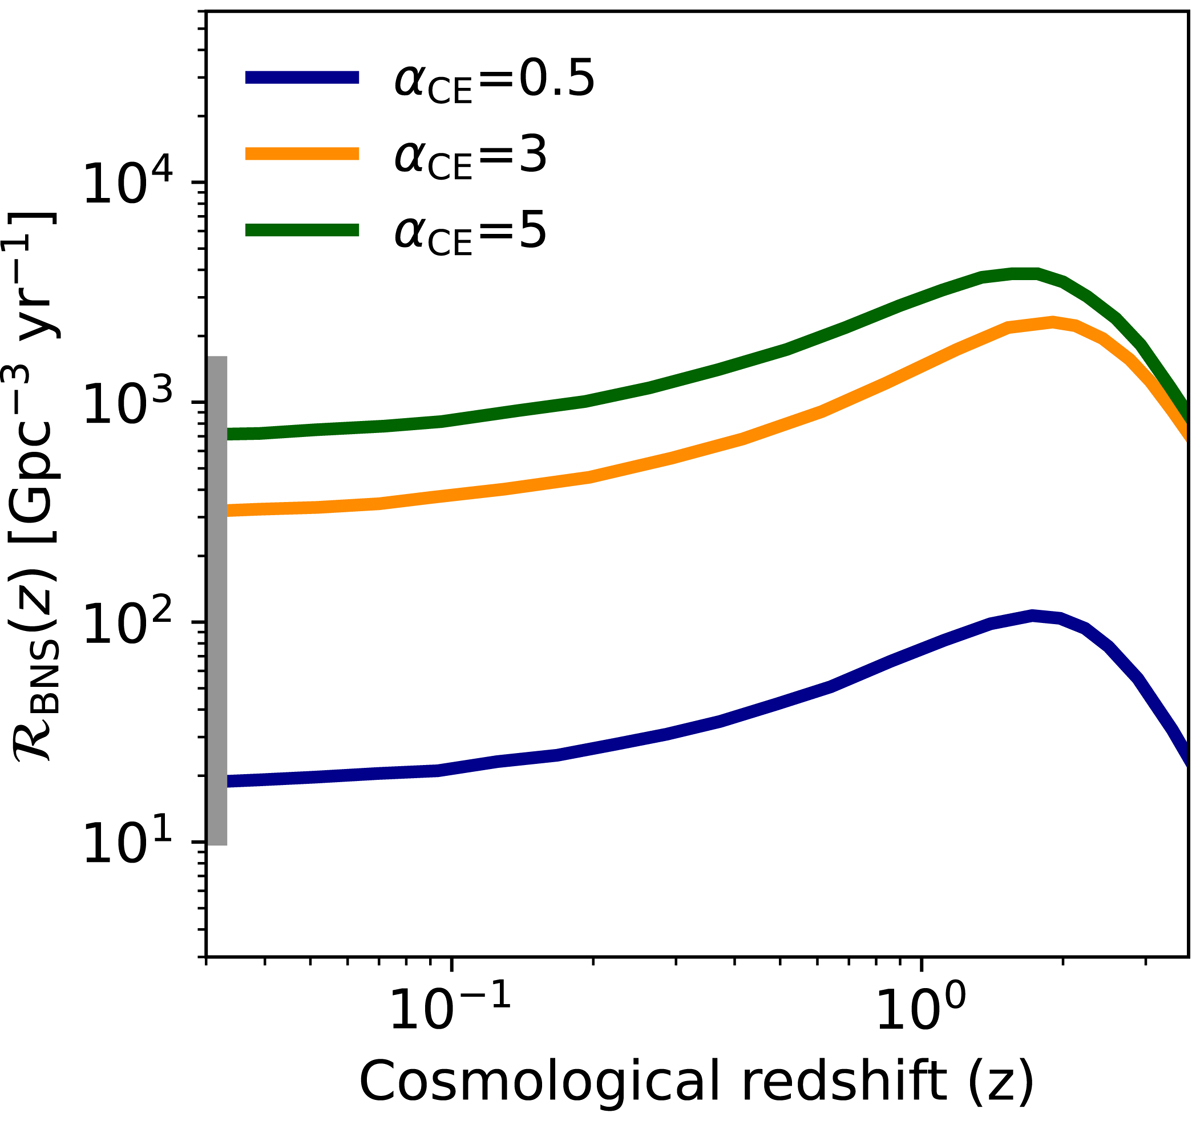
Fig. 1.
Download original image
Evolution of the merger rate density in the comoving frame as a function of redshift for the BNS populations used in the present work. Our fiducial population is obtained with a common envelope efficiency αCE = 3 and is represented by the orange solid line. The pessimistic and optimistic populations are obtained with αCE = 0.5 and 5 and are shown by blue and green solid lines, respectively. The grey area shows the 90% credible interval of the local merger rate density, as inferred from the first three observing runs of LIGO, Virgo, and KAGRA (Abbott et al. 2023).
Current usage metrics show cumulative count of Article Views (full-text article views including HTML views, PDF and ePub downloads, according to the available data) and Abstracts Views on Vision4Press platform.
Data correspond to usage on the plateform after 2015. The current usage metrics is available 48-96 hours after online publication and is updated daily on week days.
Initial download of the metrics may take a while.