Fig. 7
Download original image
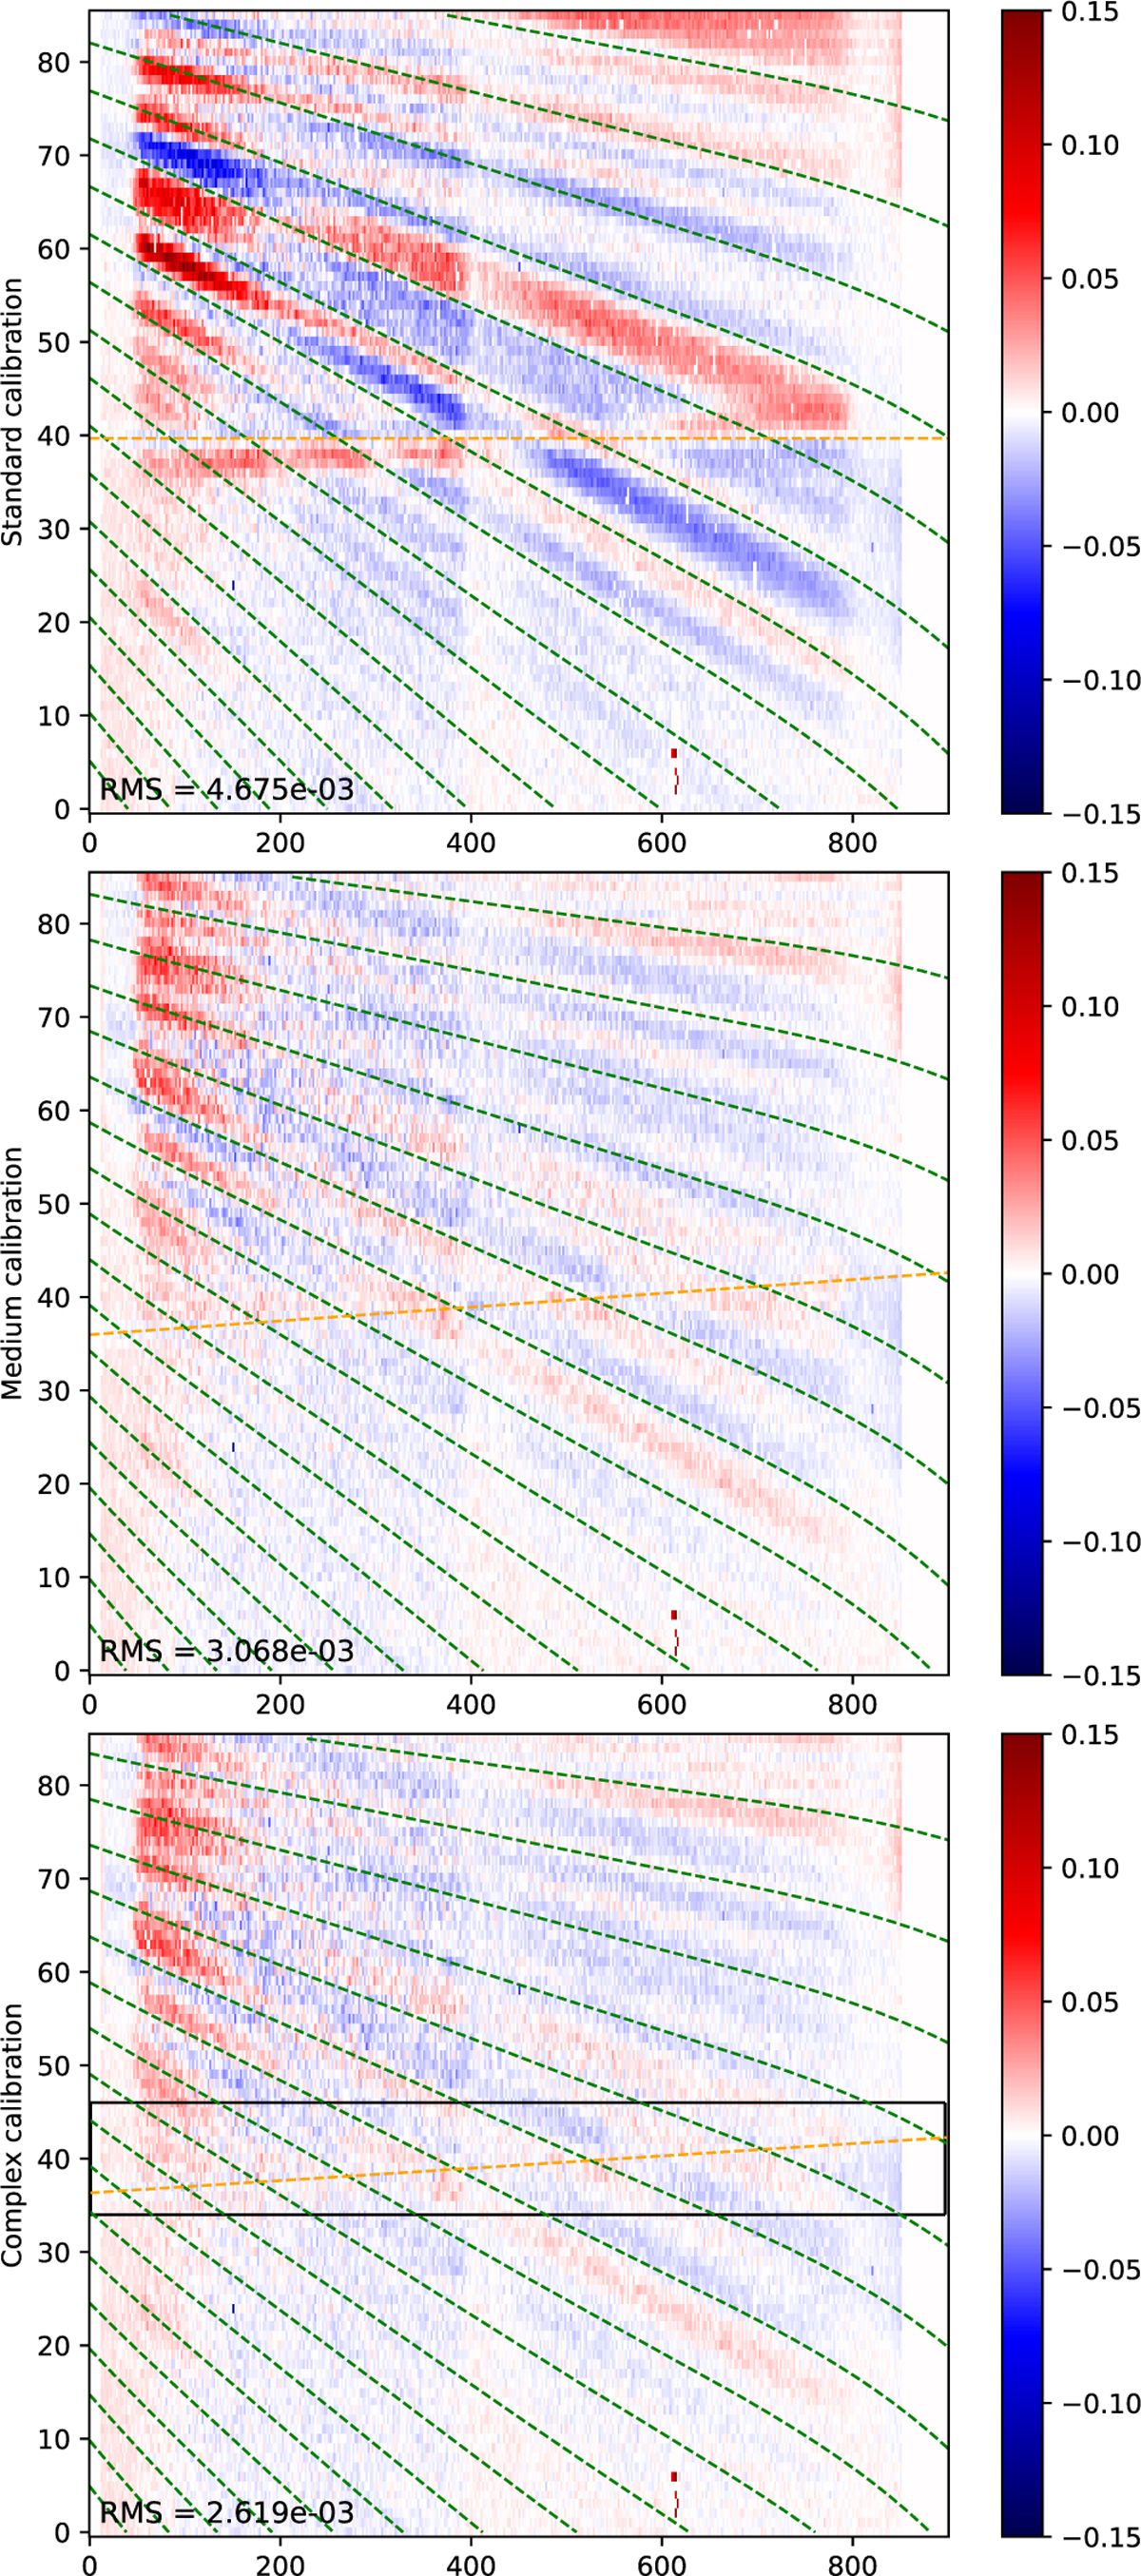
Residuals between the HR 3549 scientific data and the model of the stellar leakages, assuming a standard (top figure), medium (center), and complex (bottom) calibration models. The rms values of the residuals are given for each model. The iso-levels of ρ / λ which are approximately followed by the dispersed stellar speckles are plotted as green dashed lines. The position of the companion at the different wavelengths (i.e., at ρ = ρ⊕) is plotted as an orange dashed line.
Current usage metrics show cumulative count of Article Views (full-text article views including HTML views, PDF and ePub downloads, according to the available data) and Abstracts Views on Vision4Press platform.
Data correspond to usage on the plateform after 2015. The current usage metrics is available 48-96 hours after online publication and is updated daily on week days.
Initial download of the metrics may take a while.