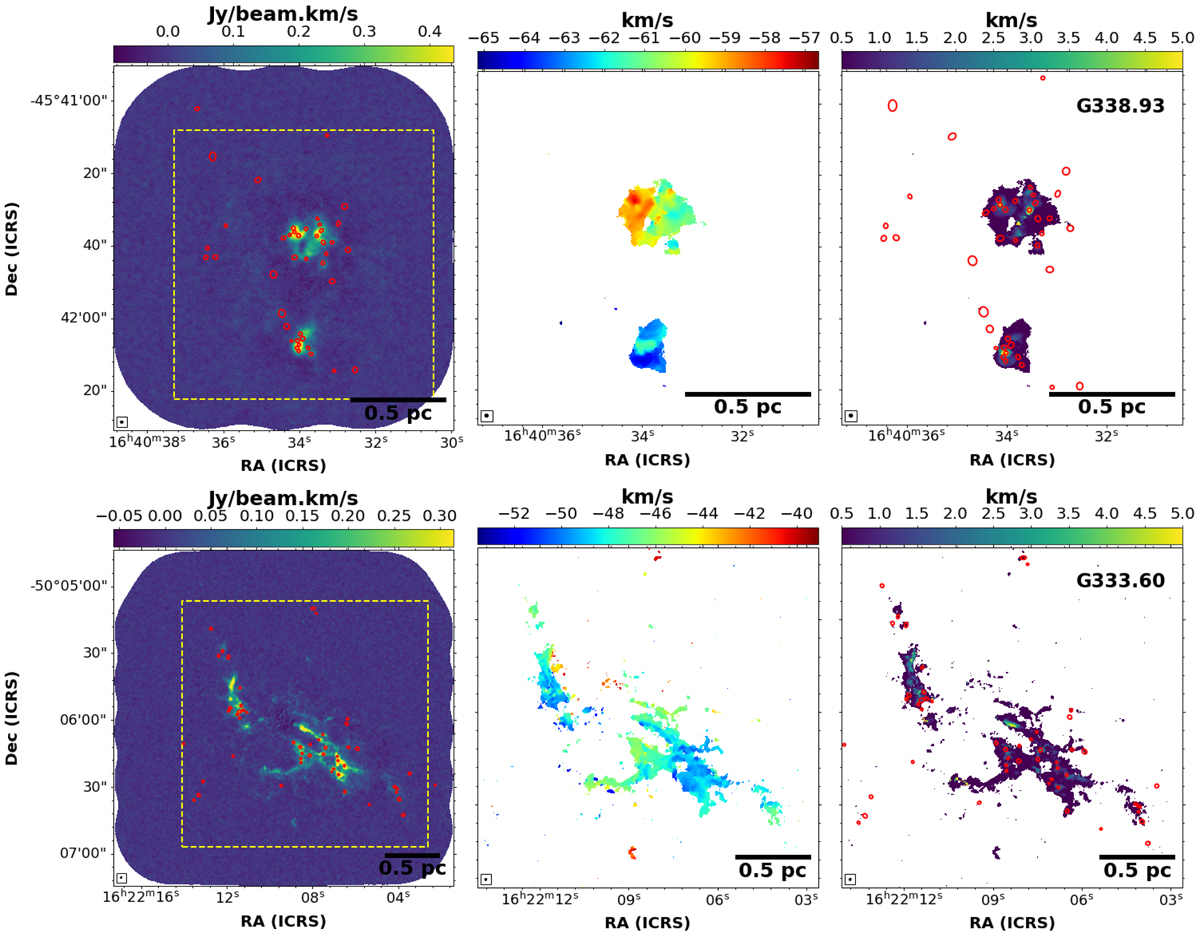
Fig. 8.
Download original image
Moment maps (moment 0, 1, and 2 in the left, centre, and right panels, respectively) of DCN (3–2) emission towards two example protoclusters with different evolutionary classifications, the young protocluster G338.93 (top), and the evolved G333.60 (bottom). All three moments have been determined over a velocity range of −53.4 to −68.6 km s−1 and −40 to −52.7 km s−1 for G338.93 and G333.60, respectively. For the moment 0 and moment 2 maps, we overlay the core positions and sizes (red ellipses) from the continuum core catalogue described in Louvet et al. (2023). For the moment 1 and moment 2 maps, we show a zoom-in of the area highlighted by the yellow dashed box overlaid on the moment 0 map. The moment 1 and moment 2 maps have an additional threshold cut per channel of 4σ. The synthesised beam is shown in the bottom left corner of each image. These maps highlight differences in the morphology traced by the DCN (3–2) emission, where the emission is more widespread and filamentary towards the evolved region G333.60 than in the young region G338.93. This trend in the DCN (3–2) emission morphology with the evolutionary stage is consistent across the full ALMA-IMF sample.
Current usage metrics show cumulative count of Article Views (full-text article views including HTML views, PDF and ePub downloads, according to the available data) and Abstracts Views on Vision4Press platform.
Data correspond to usage on the plateform after 2015. The current usage metrics is available 48-96 hours after online publication and is updated daily on week days.
Initial download of the metrics may take a while.