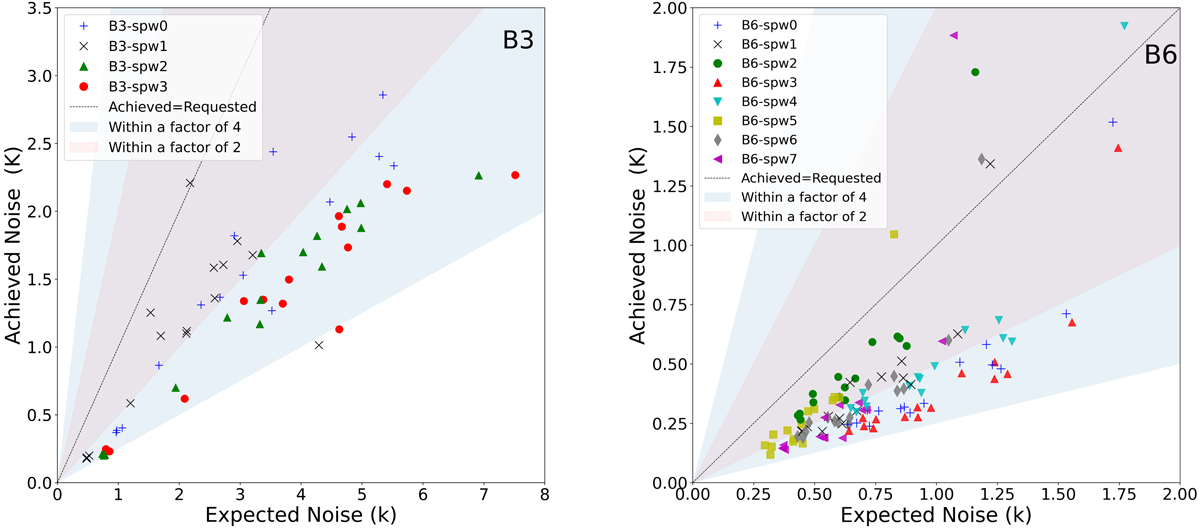
Fig. 7.
Download original image
Expected thermal noise from the observations vs the achieved noise in the cubes for each spectral window in Kelvin (B3 left panel and B6 right panel). The Y-axis shows the measured noise in the released cubes in Jy per dirty beam converted to brightness temperature as described in Sect. 3.4. The X-axis shows the expected brightness temperature sensitivity for the proposed beam sizes (see Table A.1). Furthermore, to directly compare the achieved noise in the data to the expected noise from the proposed observations, we scale the expected noise by the frequency difference between the requested representative frequency and the central frequency of each spectral window. We also scale the expected noise by the difference in the representative channel width and the achieved channel width for each spectral window. As shown in Fig. 5, the achieved beam area is typically larger than the continuum beam by ∼1–1.5×. Thus, the expected noise is also scaled to account for the difference in the beam areas between the achieved and proposed beams (see Table A.2 for the exact proposed beams and achieved beams per field). The shaded regions show a noise within a factor of two (pink) and four (blue) from the expected noise, and the dashed line represents a 1 to 1 ratio. We typically achieve a noise on average ∼2–2.5 times lower than expected.
Current usage metrics show cumulative count of Article Views (full-text article views including HTML views, PDF and ePub downloads, according to the available data) and Abstracts Views on Vision4Press platform.
Data correspond to usage on the plateform after 2015. The current usage metrics is available 48-96 hours after online publication and is updated daily on week days.
Initial download of the metrics may take a while.