Fig. 6.
Download original image
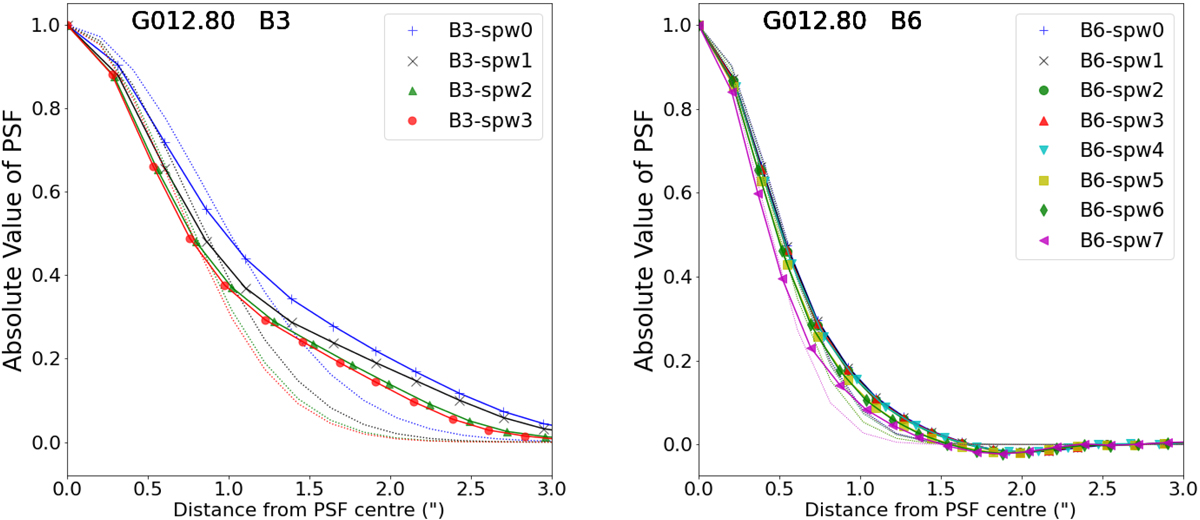
Absolute value of the radial mean of the PSF (dirty beam) for the protocluster G012.80 as a function of the distance from the PSF centre (in arcseconds). B3 spectral windows are shown on the left and B6 spectral windows are on the right. The solid lines use the .psf outputs from tclean and the dashed lines are the expected Gaussian clean beams (the FWHM is taken from the geometric mean of the beam major and minor axes). For the B3 spectral windows, the Gaussian clean beam is a good approximation to the PSF only within ∼50% of its FWHM. B3 spectral window 0 shows the largest deviation, resulting in a larger estimation of the respective Gaussian clean beam in tclean. The B6 spectral windows typically show a better correspondence between the PSFs and the Gaussian clean beam.
Current usage metrics show cumulative count of Article Views (full-text article views including HTML views, PDF and ePub downloads, according to the available data) and Abstracts Views on Vision4Press platform.
Data correspond to usage on the plateform after 2015. The current usage metrics is available 48-96 hours after online publication and is updated daily on week days.
Initial download of the metrics may take a while.