Fig. 5.
Download original image
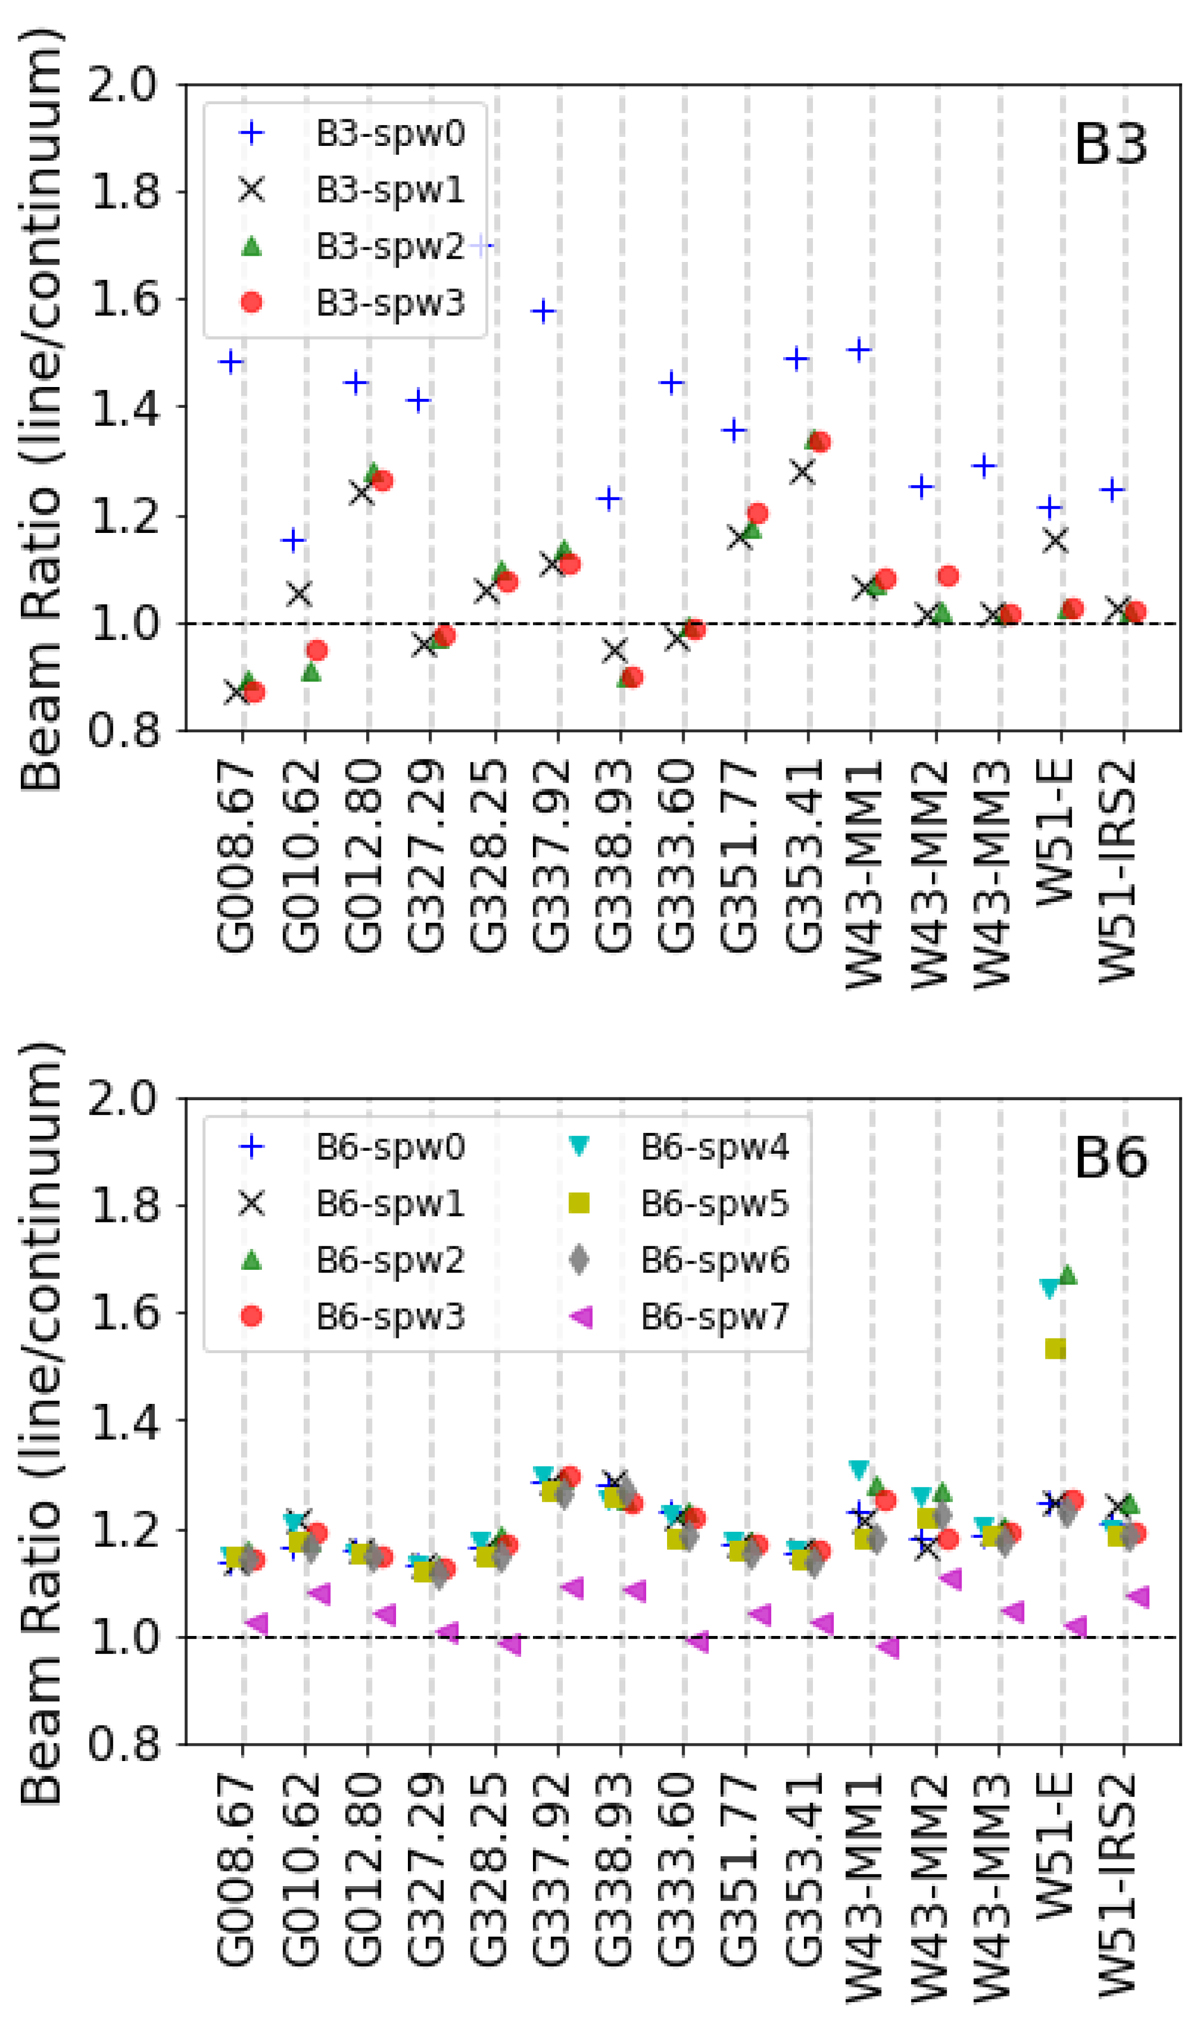
Ratio of the average line to continuum beam for each protocluster and spectral window (B3 top; B6 bottom panels). Where the average beam is defined as ![]() . We scale the ratio linearly to account for the frequency difference between the central frequency of the spectral window and the frequency of the continuum beam. The native beam major and minor axis for each spectral window is listed in Table A.2. The proposed beam and the average recovered continuum beam for all fields are given in Table A.1. The central frequency of the continuum images for B3 and B6 for each protocluster is given in Ginsburg et al. (2022a), and the spectral coverage for each of the line cubes are shown in Table A.3. The dashed horizontal line shows a one-to-one ratio between the line and continuum beams.
. We scale the ratio linearly to account for the frequency difference between the central frequency of the spectral window and the frequency of the continuum beam. The native beam major and minor axis for each spectral window is listed in Table A.2. The proposed beam and the average recovered continuum beam for all fields are given in Table A.1. The central frequency of the continuum images for B3 and B6 for each protocluster is given in Ginsburg et al. (2022a), and the spectral coverage for each of the line cubes are shown in Table A.3. The dashed horizontal line shows a one-to-one ratio between the line and continuum beams.
Current usage metrics show cumulative count of Article Views (full-text article views including HTML views, PDF and ePub downloads, according to the available data) and Abstracts Views on Vision4Press platform.
Data correspond to usage on the plateform after 2015. The current usage metrics is available 48-96 hours after online publication and is updated daily on week days.
Initial download of the metrics may take a while.