Fig. 4.
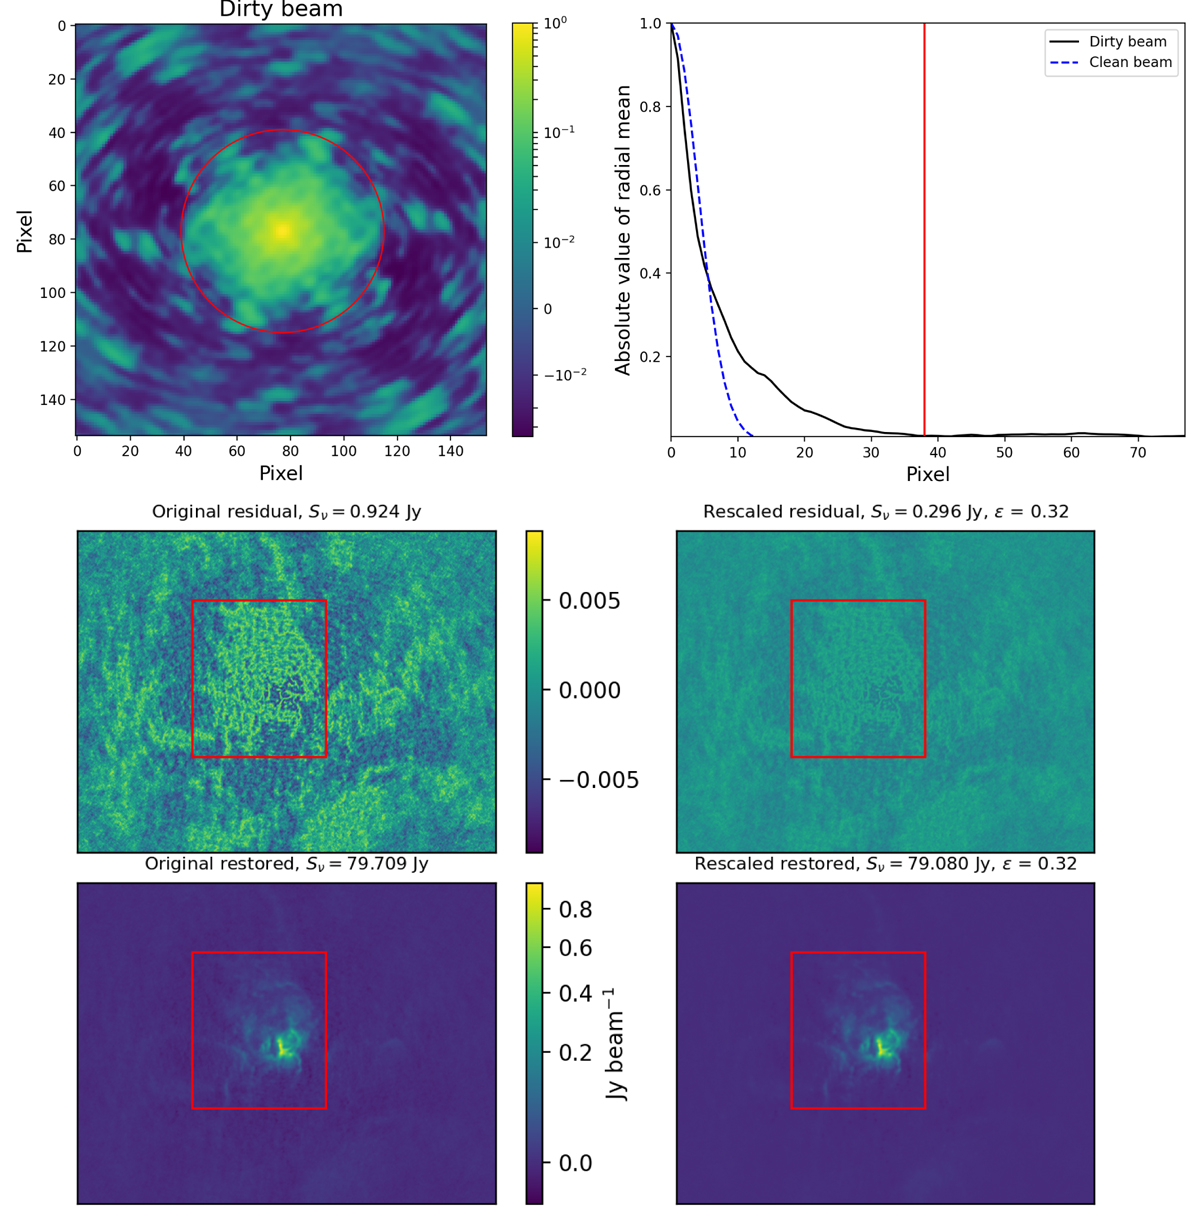
Download original image
Example of the JvM correction for the peak channel of the H41α line in spectral window 1 of Band 3 for protocluster G333.60. The top left panel shows the original PSF (i.e. the dirty beam), where the red circle marks the first null. The top right panel shows the absolute value of the radial profile of the beam (black solid line) and the corresponding approximation to a Gaussian clean beam (blue dashed line). The ϵ factor, defined as the ratio of the clean-to-dirty beam volumes, is 0.32 in this example. The residuals are shown for the original image (middle left panel) and after (middle right), the JvM correction is applied. The red rectangle shows the aperture where the quoted fluxes are measured. The restored images without (bottom left) and with JvM (bottom right) correction are shown in the bottom panels.
Current usage metrics show cumulative count of Article Views (full-text article views including HTML views, PDF and ePub downloads, according to the available data) and Abstracts Views on Vision4Press platform.
Data correspond to usage on the plateform after 2015. The current usage metrics is available 48-96 hours after online publication and is updated daily on week days.
Initial download of the metrics may take a while.