Fig. 2.
Download original image
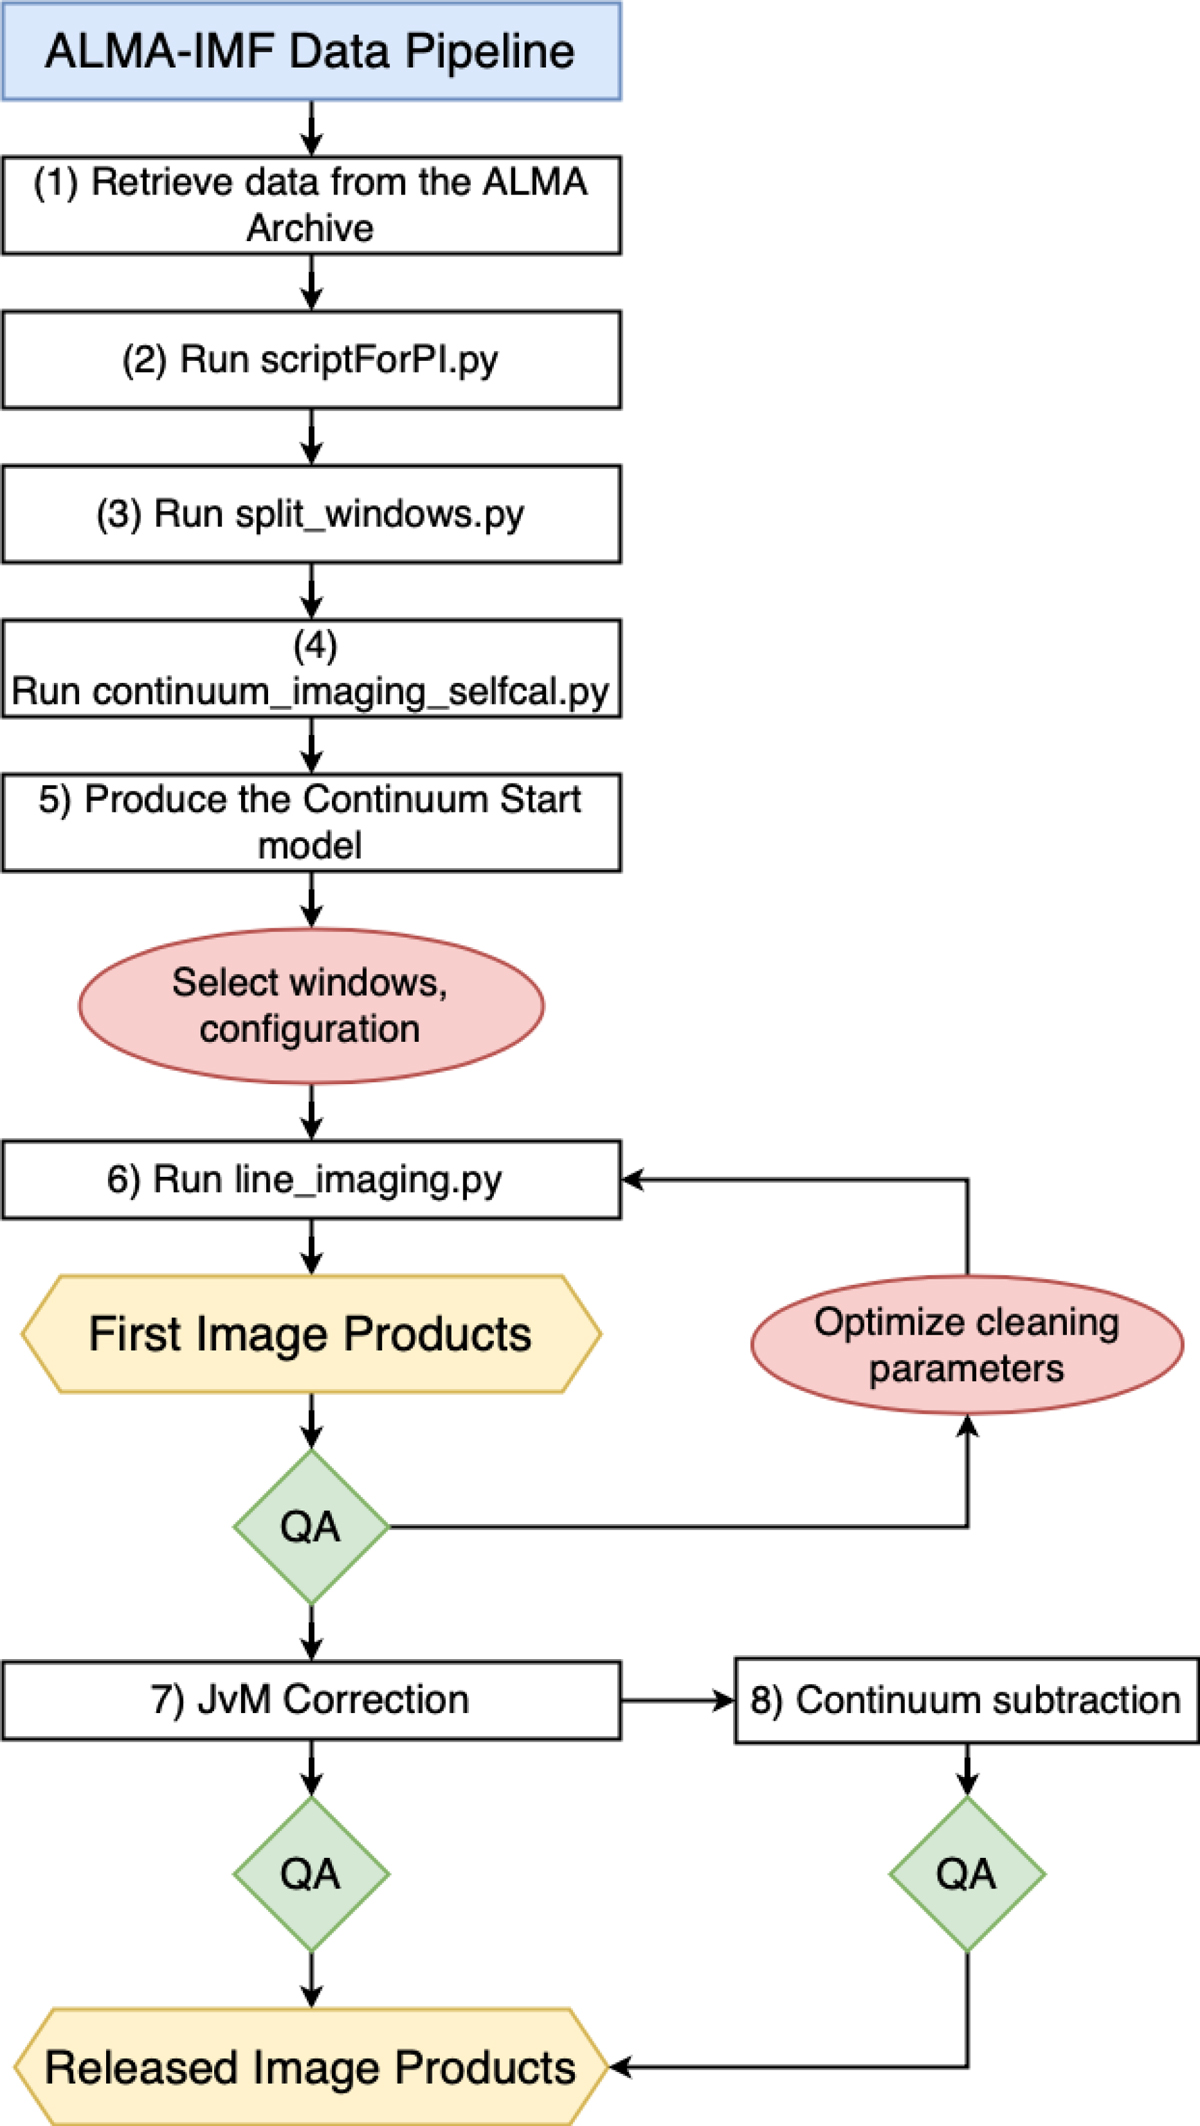
Flow chart providing an overview of the framework of the ALMA-IMF data pipeline employed to produce the line cubes provided in this release. The white boxes labelled from 1–8 describe the steps in the pipeline that are defined by running scripts or procedures (as described in more detail in Sect. 3.1). Red ellipses highlight points where manual input was required to either select which line, spectral window, or configuration on which to perform tclean, or to optimise the tclean parameters after internal quality assessments (green diamonds).
Current usage metrics show cumulative count of Article Views (full-text article views including HTML views, PDF and ePub downloads, according to the available data) and Abstracts Views on Vision4Press platform.
Data correspond to usage on the plateform after 2015. The current usage metrics is available 48-96 hours after online publication and is updated daily on week days.
Initial download of the metrics may take a while.