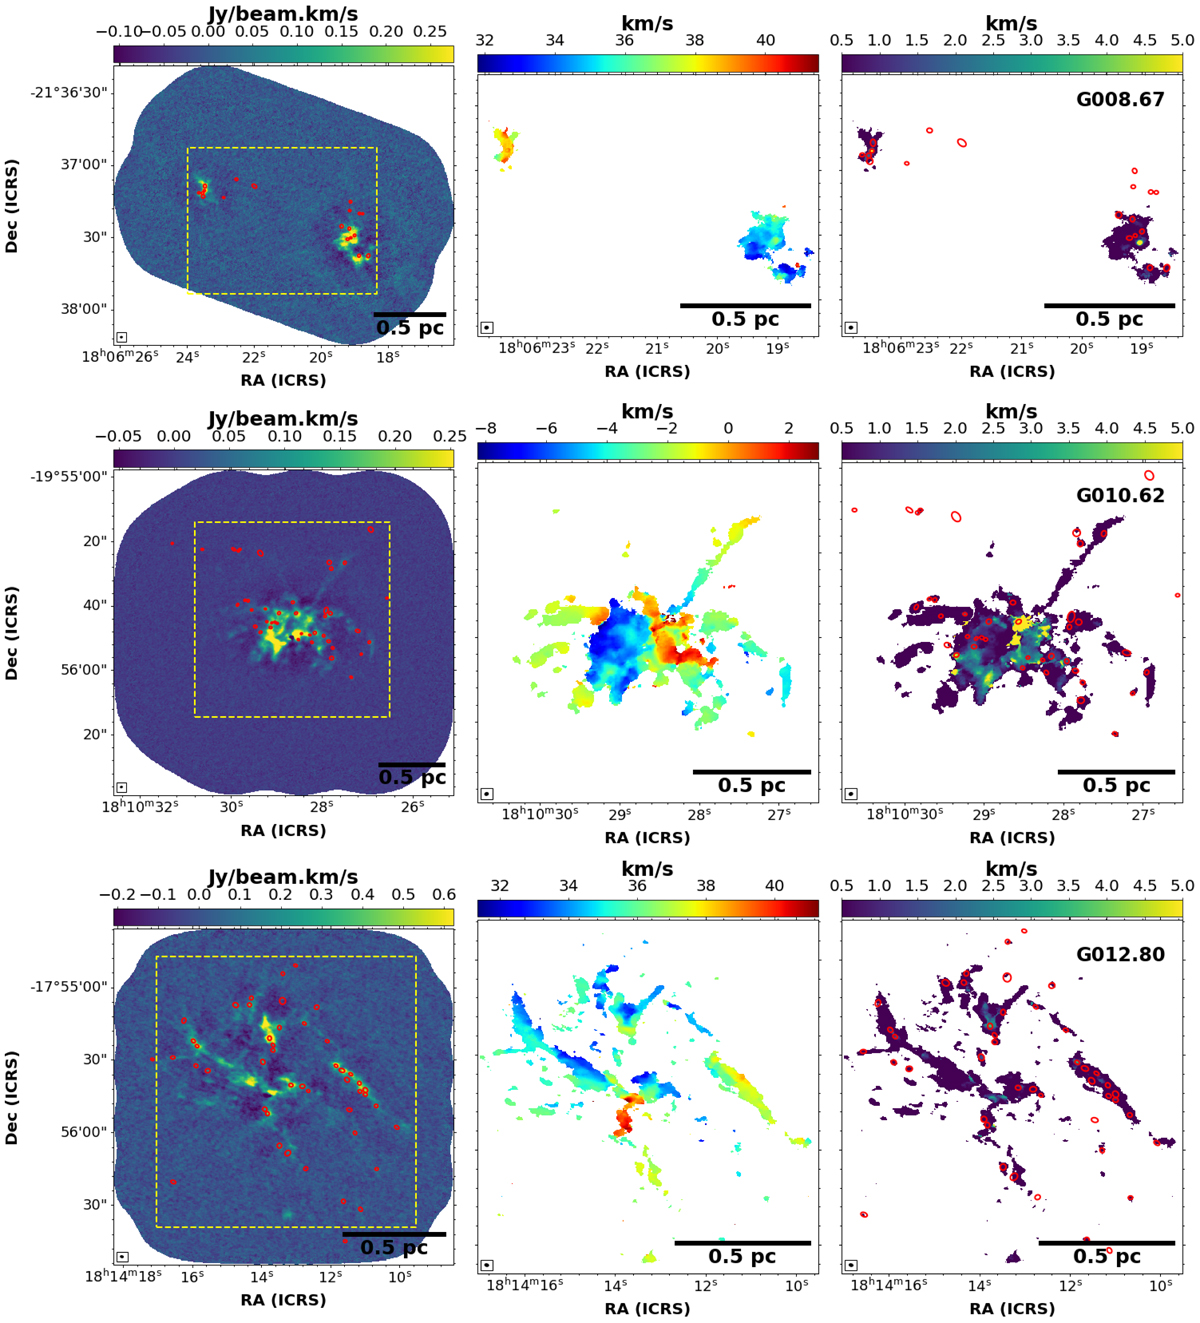
Fig. D.1.

Download original image
Moment maps (moment 0, 1, and 2 in the left, centre, and right panels, respectively) of DCN (3-2) emission towards the protoclusters G008.67 (top), G010.62 (middle), and G012.80 (bottom). All three moments have been determined over a velocity range of 31.7 to 43 km s−1, −9.3 to 5.8 km s−1, and 30.7 to 43 km s−1 for G008.67, G010.62, and G012.80, respectively. For the moment 0 and moment 2 maps, we overlay the core positions and sizes (red ellipses) from the continuum core catalogue described in Louvet et al. (2023). For the moment 1 and moment 2 maps, we show a zoom-in of the area highlighted by the yellow dashed box overlaid on the moment 0 map. The moment 1 and moment 2 maps have an additional threshold cut per channel of 4 σ. The synthesised beam is shown in the bottom left corner of each image.
Current usage metrics show cumulative count of Article Views (full-text article views including HTML views, PDF and ePub downloads, according to the available data) and Abstracts Views on Vision4Press platform.
Data correspond to usage on the plateform after 2015. The current usage metrics is available 48-96 hours after online publication and is updated daily on week days.
Initial download of the metrics may take a while.


