Fig. 17.

Download original image
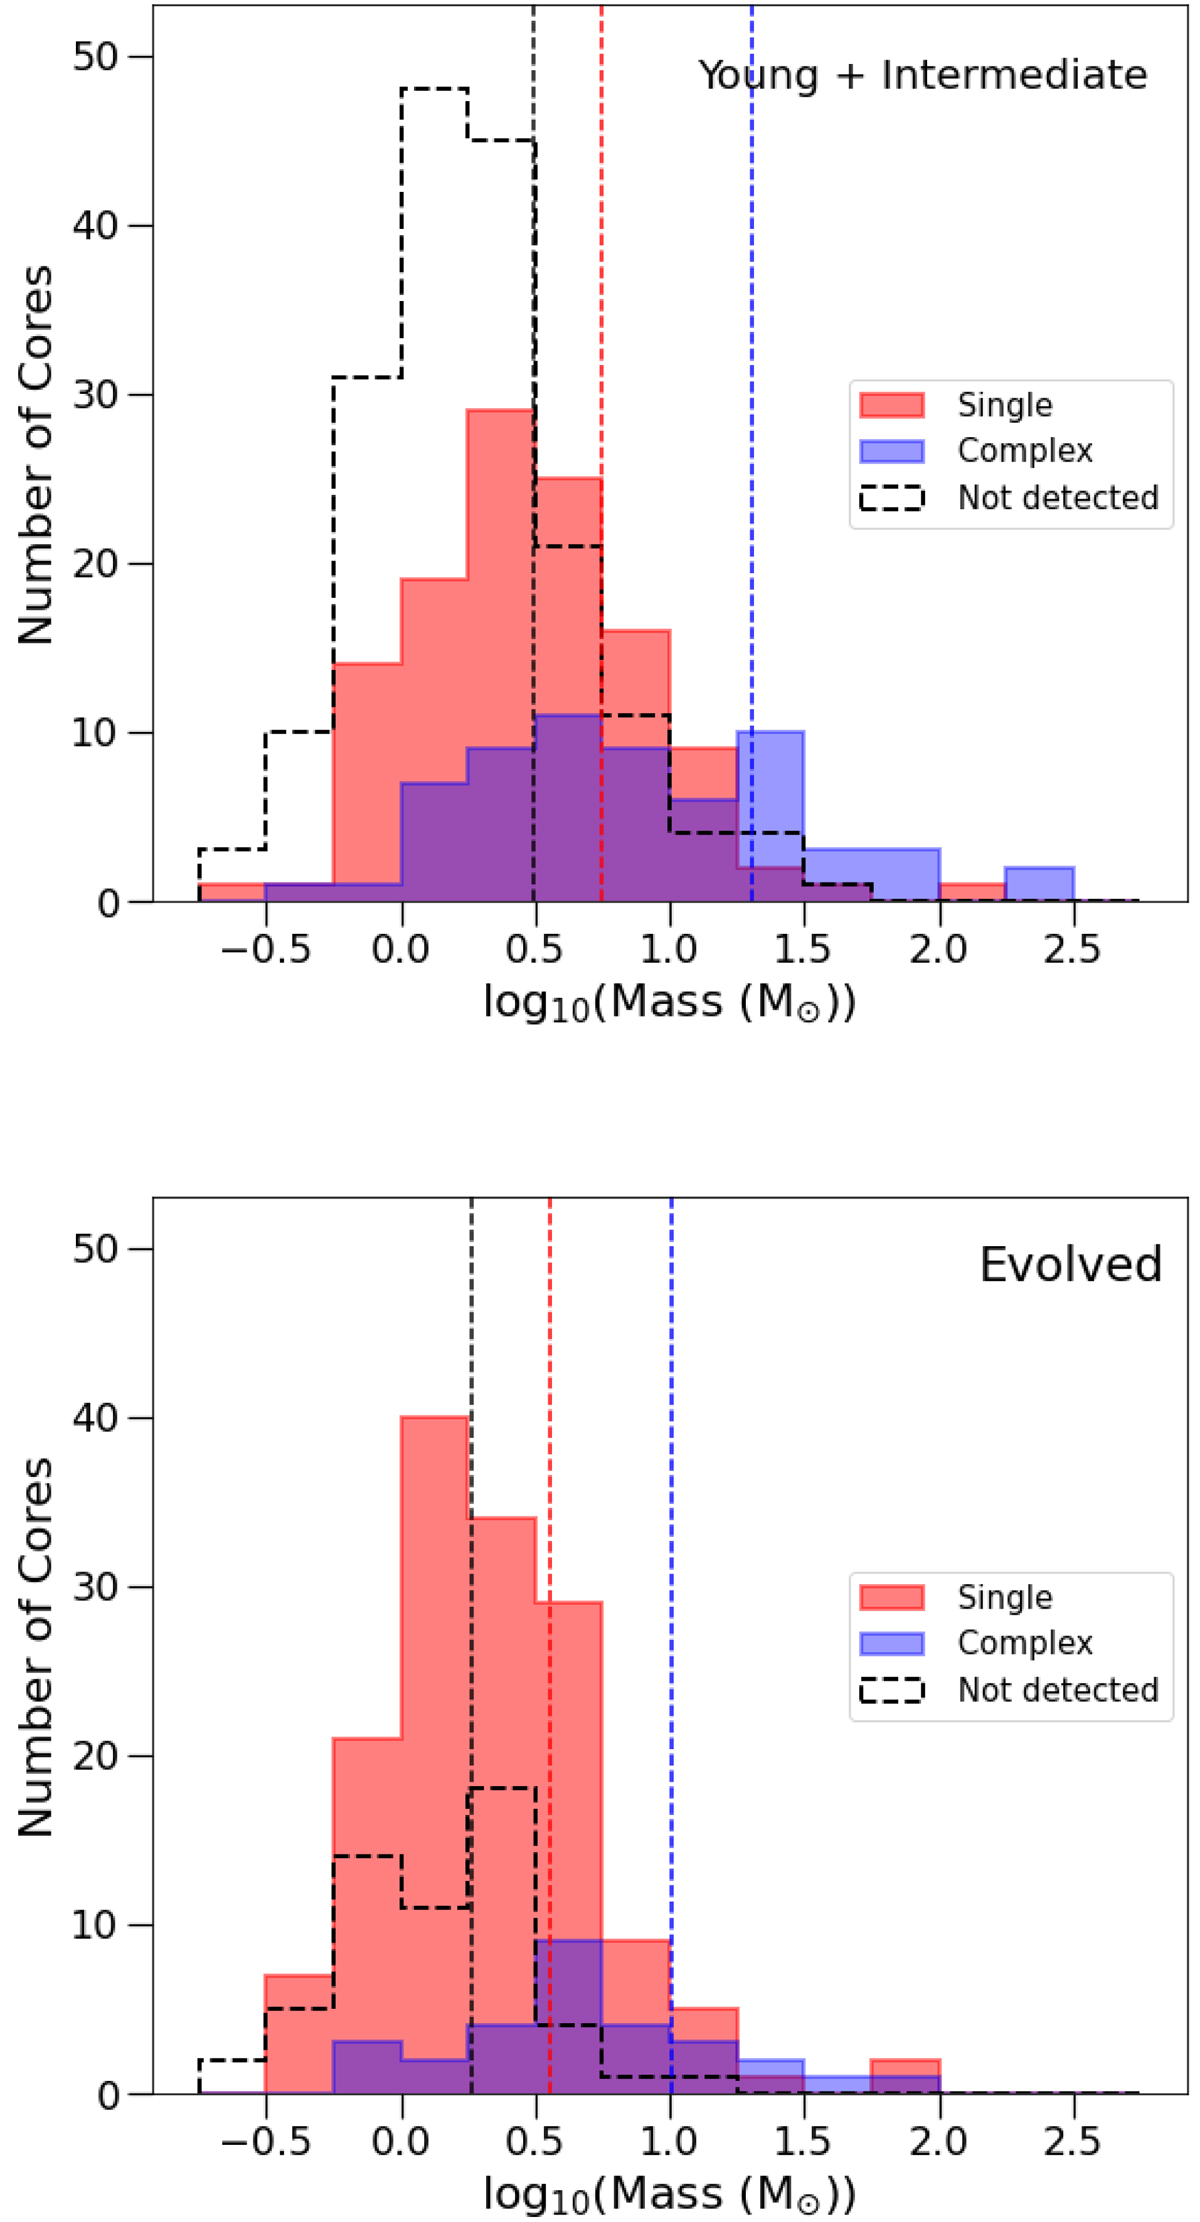
Histograms of the mass distribution (in log scale) of the cores in the combined young + intermediate regions (top panel) and evolved regions (bottom panel). The shaded red and blue areas show the cores with single-type DCN (3–2) and complex-type spectra, respectively. The dashed black line represents cores with a DCN (3–2) non-detection. The red, blue, and black dashed vertical lines represent the average mass values (top: 5.6 M⊙, 20.1 M⊙, and 3.1 M⊙; bottom: 3.6 M⊙, 10.2 M⊙, and 1.8 M⊙) for the single-, complex-type, and non-detections, respectively. We find that the complex-type cores have an average mass nearly an order of magnitude higher than those without a DCN (3–2) detection and around three times higher than cores with a single-type DCN detection, regardless of evolutionary class.
Current usage metrics show cumulative count of Article Views (full-text article views including HTML views, PDF and ePub downloads, according to the available data) and Abstracts Views on Vision4Press platform.
Data correspond to usage on the plateform after 2015. The current usage metrics is available 48-96 hours after online publication and is updated daily on week days.
Initial download of the metrics may take a while.


