Fig. 16.
Download original image
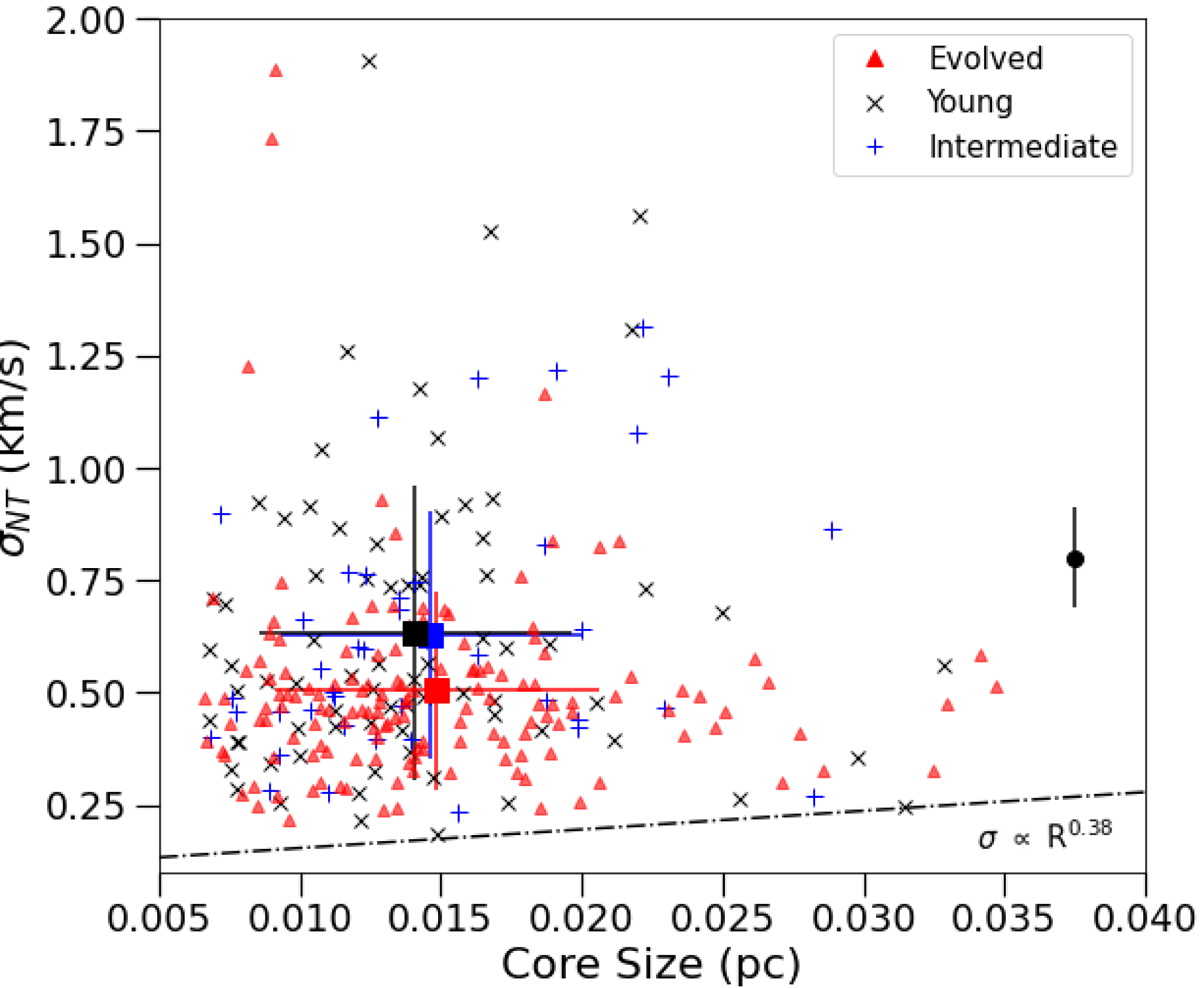
Distribution of the core-size as a function of the respective non-thermal velocity dispersion from the DCN (3-2) spectra. The red triangles, blue plusses, and black crosses represent evolved, intermediate, and young protoclusters, respectively. The red, blue, and black squares are the average values (0.50 km s−1, 0.63 km s−1, and 0.63 km s−1) for the collective evolved, intermediate and young values, respectively, where the error bars represent the standard deviations (0.22 km s−1, 0.27 km s−1, and 0.33 km s−1, respectively). The black dashed line is the Larson relation (Larson 1981), and nearly all cores are above it. The black circle and error bar provide an estimate of the typical errors on the linewidth estimates. We find no correlation between the non-thermal velocity dispersion with core-size in the ranges of values sampled here.
Current usage metrics show cumulative count of Article Views (full-text article views including HTML views, PDF and ePub downloads, according to the available data) and Abstracts Views on Vision4Press platform.
Data correspond to usage on the plateform after 2015. The current usage metrics is available 48-96 hours after online publication and is updated daily on week days.
Initial download of the metrics may take a while.