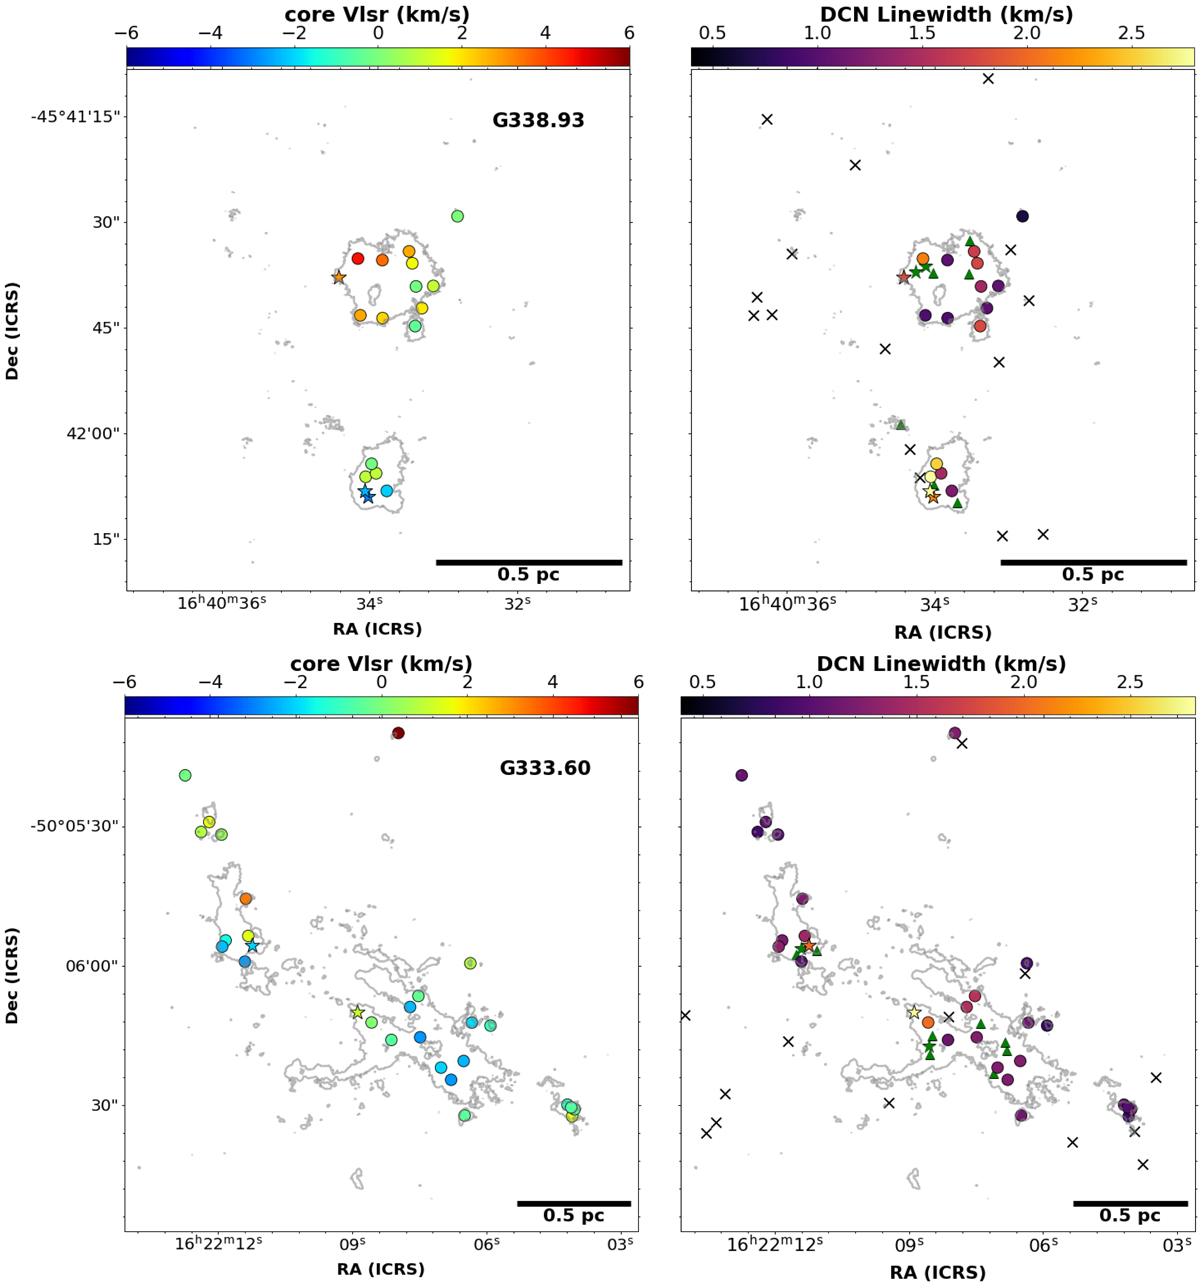
Fig. 13.
Download original image
Core VLSR (left) and DCN (3–2) linewidths (right) estimated from the DCN (3–2) fits to the continuum cores towards examples of a young and an evolved protocluster G338.93 (top) and G333.60 (bottom), respectively. The circles and stars represent the detected cores with mass estimates below and above 8 M⊙, respectively, with the colour scale displaying the fitted parameters from the DCN (3–2) fits (left: core VLSR, right: linewidth). The core VLSR is the centroid velocity of the DCN (3–2) fit minus the cloud VLSR (taken as −62 km s−1, and −47 km s−1 for G338.93, and G333.60, respectively). The grey contours are the 4σ level of the DCN (3–2) moment 0 map. In the right panels, the positions of cores without a DCN (3–2) detection are marked with a black cross and with a black star for cores with a mass estimate below and above 8 M⊙, respectively, and green triangles and stars represent cores with a complex-type DCN (3–2) spectra, with a mass estimate below and above 8 M⊙, respectively.
Current usage metrics show cumulative count of Article Views (full-text article views including HTML views, PDF and ePub downloads, according to the available data) and Abstracts Views on Vision4Press platform.
Data correspond to usage on the plateform after 2015. The current usage metrics is available 48-96 hours after online publication and is updated daily on week days.
Initial download of the metrics may take a while.