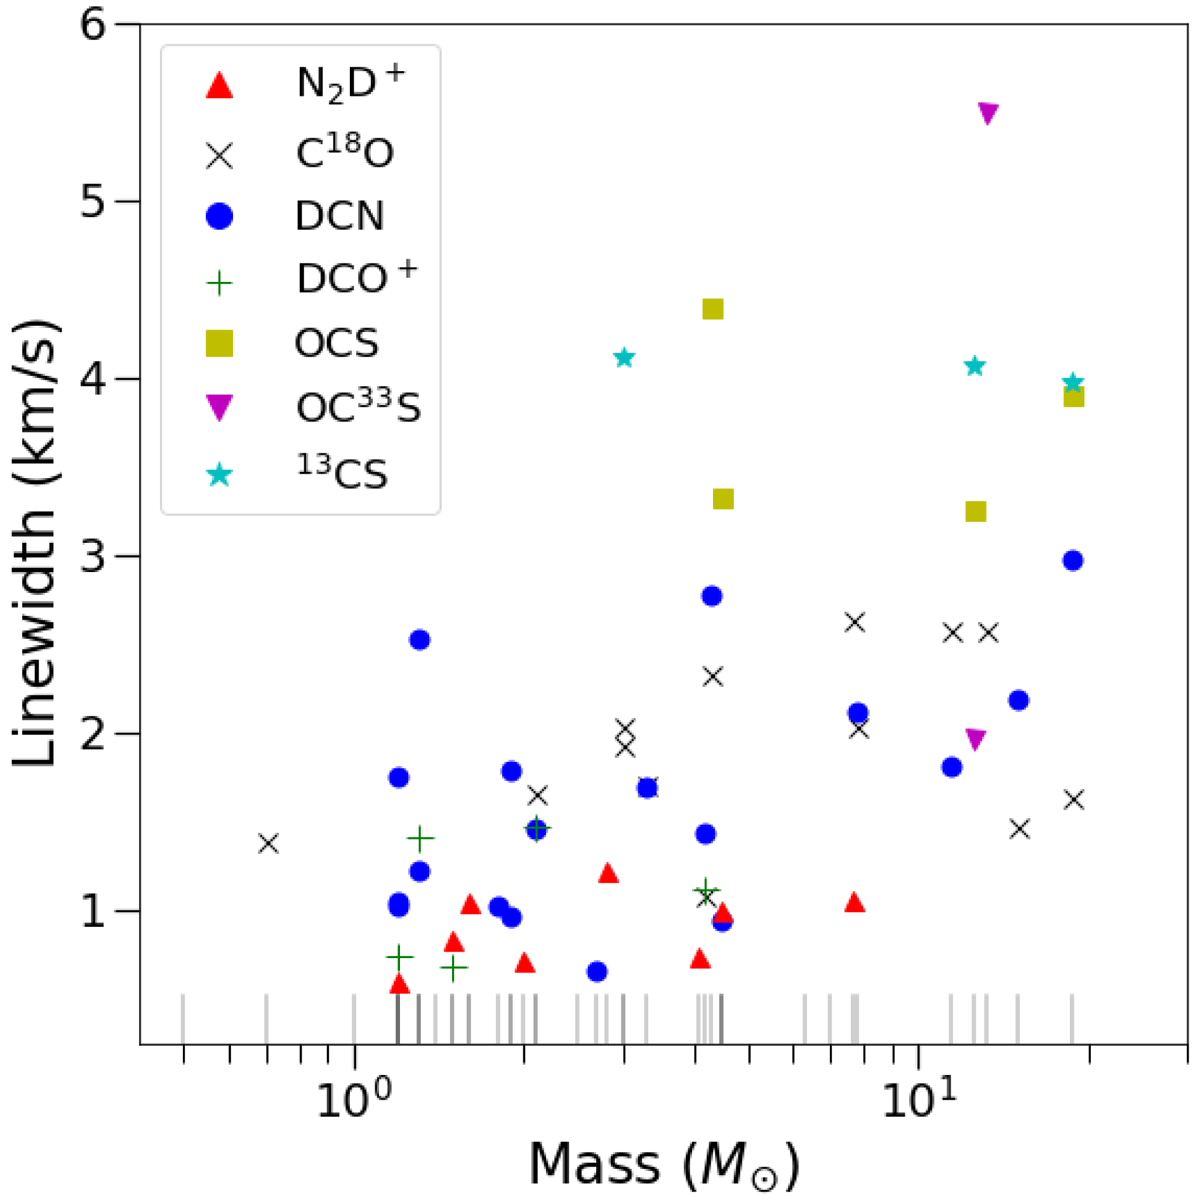
Fig. 12.
Download original image
Linewidths extracted towards the core population of G338.93 for the molecules listed in Table 5 as a function of the continuum core masses taken from Louvet et al. (2023), assuming the core dust temperature estimates as given in Table 3. The linewidths shown are from fits classified as single-type which can be well approximated by a single Gaussian (or single HFS fit for DCN) component fit to the extracted spectrum. The grey vertical lines represent the masses of all 42 cores in the G338.93 protocluster. DCN (3–2) well represents the full mass range of the cores in the protocluster.
Current usage metrics show cumulative count of Article Views (full-text article views including HTML views, PDF and ePub downloads, according to the available data) and Abstracts Views on Vision4Press platform.
Data correspond to usage on the plateform after 2015. The current usage metrics is available 48-96 hours after online publication and is updated daily on week days.
Initial download of the metrics may take a while.