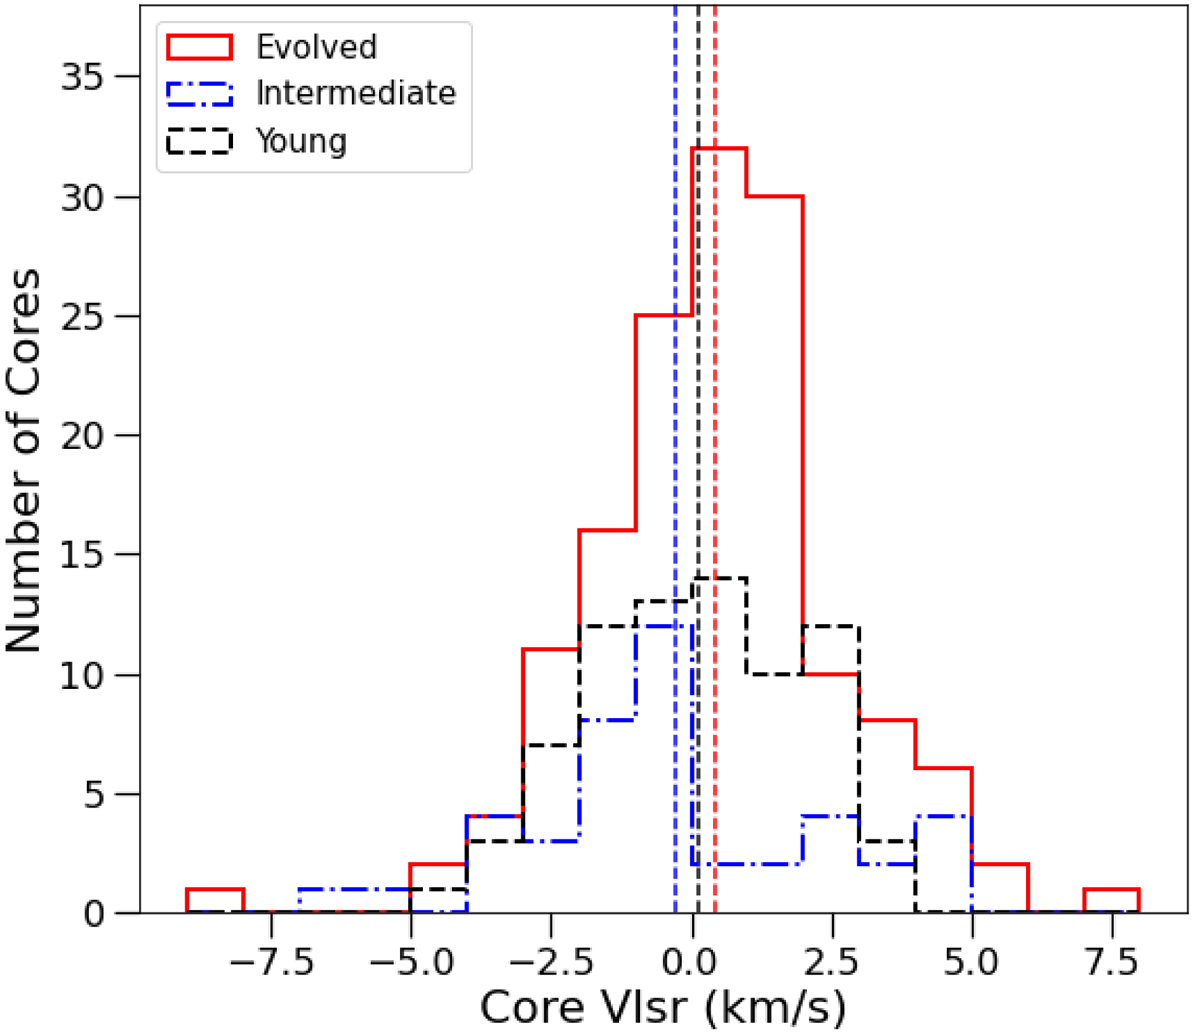
Fig. 11.
Download original image
Distribution of the core velocities from the DCN line fits split by evolutionary stage. The velocity offset is determined as the central velocity of the fit and subtracting from it the average protocluster velocity (estimated from the average of the DCN (3–2) moment 1 maps). The vertical dashed lines are the average values for each subgroup (0.13 km s−1, −0.29 km s−1, and 0.44 km s−1 for the young, intermediate and evolved regions, respectively). We find no obvious dependence on the distribution of the core velocities over the sample.
Current usage metrics show cumulative count of Article Views (full-text article views including HTML views, PDF and ePub downloads, according to the available data) and Abstracts Views on Vision4Press platform.
Data correspond to usage on the plateform after 2015. The current usage metrics is available 48-96 hours after online publication and is updated daily on week days.
Initial download of the metrics may take a while.