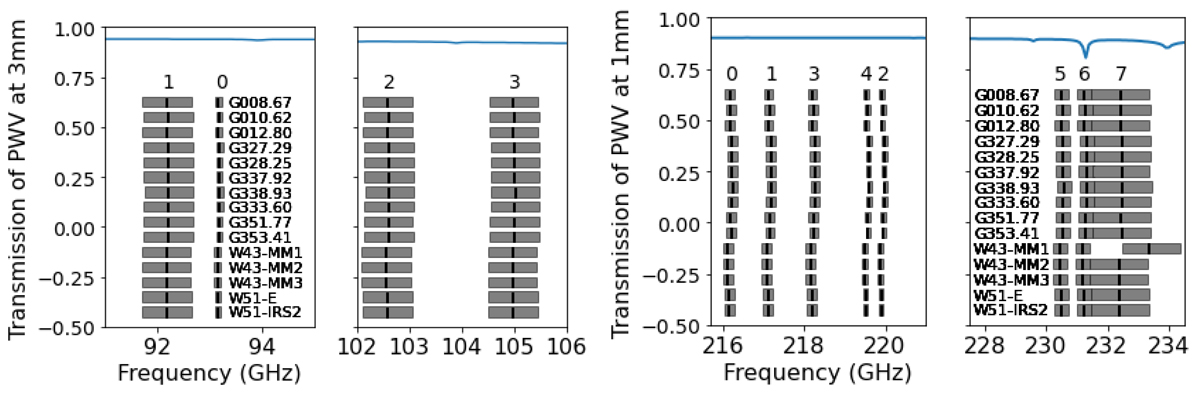
Fig. 1.
Download original image
Overview of the bandwidth covered by the spectral windows (spws, grey boxes), four in B3 (left panels) and eight in B6 (right panels) towards the 15 ALMA-IMF fields. The black line represents the central frequency for each spectral window. The numbers at the top denote the spectral windows as described in Table 2. The exact frequency coverage is provided in Table A.3. The blue line is the atmospheric transmission at a precipitable water vapour (PWV; The values over the observed frequency range are taken from https://www.apex-telescope.org/sites/chajnantor/atmosphere/transpwv/index_ns.php) of 1.796 mm in B6 and 5.18 mm in B3 (the typical values used in the ALMA sensitivity calculator), for a source at an elevation of 45 degrees. The coverage of the ALMA-IMF pilot program (B6 spectral window 7 for the W43-MM1 field) is offset by 1 GHz.
Current usage metrics show cumulative count of Article Views (full-text article views including HTML views, PDF and ePub downloads, according to the available data) and Abstracts Views on Vision4Press platform.
Data correspond to usage on the plateform after 2015. The current usage metrics is available 48-96 hours after online publication and is updated daily on week days.
Initial download of the metrics may take a while.