Fig. 6.
Download original image
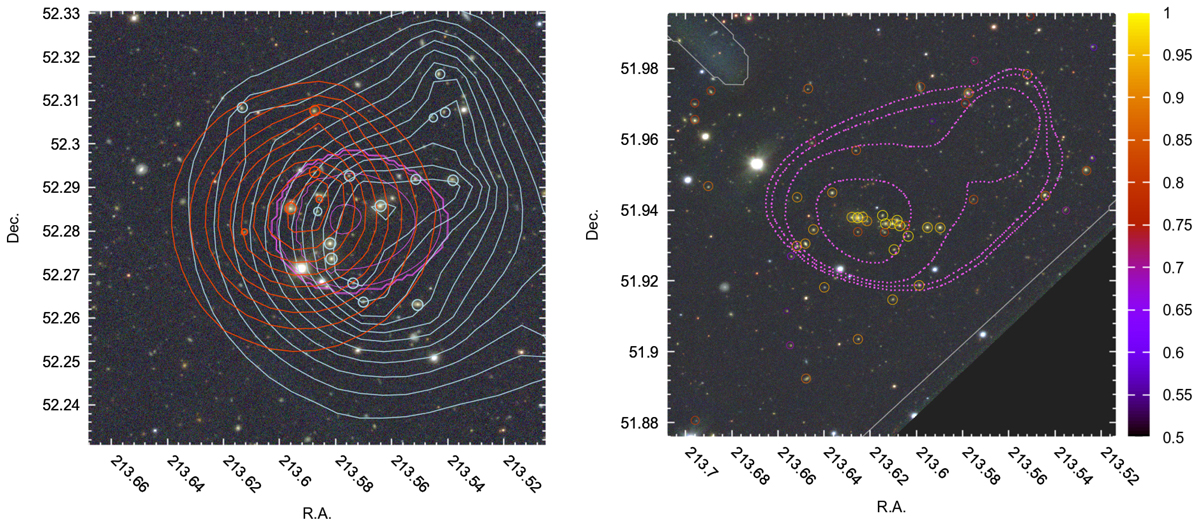
Examples of detected clusters and associated cluster members. Left panel: two clusters located along the same line of sight, but at two different redshifts (z = 0.233 ± 0.005 and z = 0.391 ± 0.005) displayed together with the map of the amplitude A measured by AMICO (cyan and red isodensity contours, respectively); the galaxy members with a probabilistic association P > 0.5 are indicated by circles. The filter response of AMICO is shown with the isocontours, blue for the lower redshift cluster and red for the higher redshift cluster. Right panel: most massive cluster in the sample having an X-ray mass of M = 8.6 ± 0.7 × 10¹³ M⊙ and located at z = 0.29. Here the colour of the circles indicate the probabilistic membership association of the members. The white lines represent the masked areas and the survey limit. In both panels the magenta contours show the extended X-ray emission.
Current usage metrics show cumulative count of Article Views (full-text article views including HTML views, PDF and ePub downloads, according to the available data) and Abstracts Views on Vision4Press platform.
Data correspond to usage on the plateform after 2015. The current usage metrics is available 48-96 hours after online publication and is updated daily on week days.
Initial download of the metrics may take a while.