Fig. 5.
Download original image
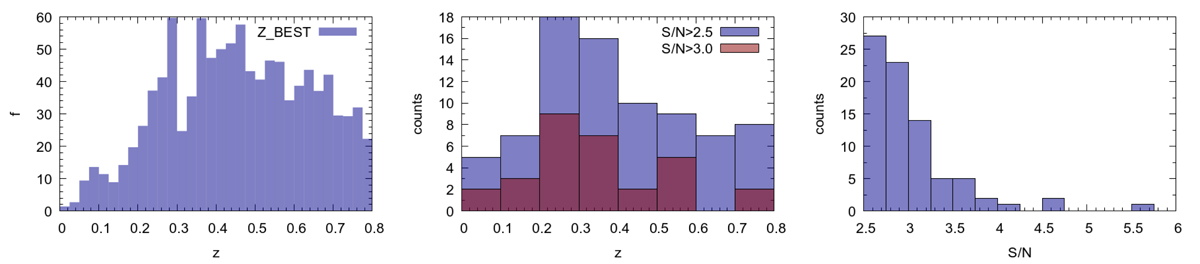
Redshift distribution of miniJPAS galaxies (left panel) and AMICO cluster detections (central panel; blue and red histograms for detections with S/N > 2.5 and S/N > 3, respectively). The large fluctuations in the number of galaxies and clusters are physical and are due to large-scale structure of the field, as confirmed by the spectroscopic redshifts (Bonoli et al. 2021). The right panel shows the distribution of signal-to-noise ratio of the detections.
Current usage metrics show cumulative count of Article Views (full-text article views including HTML views, PDF and ePub downloads, according to the available data) and Abstracts Views on Vision4Press platform.
Data correspond to usage on the plateform after 2015. The current usage metrics is available 48-96 hours after online publication and is updated daily on week days.
Initial download of the metrics may take a while.