Fig. 2.
Download original image
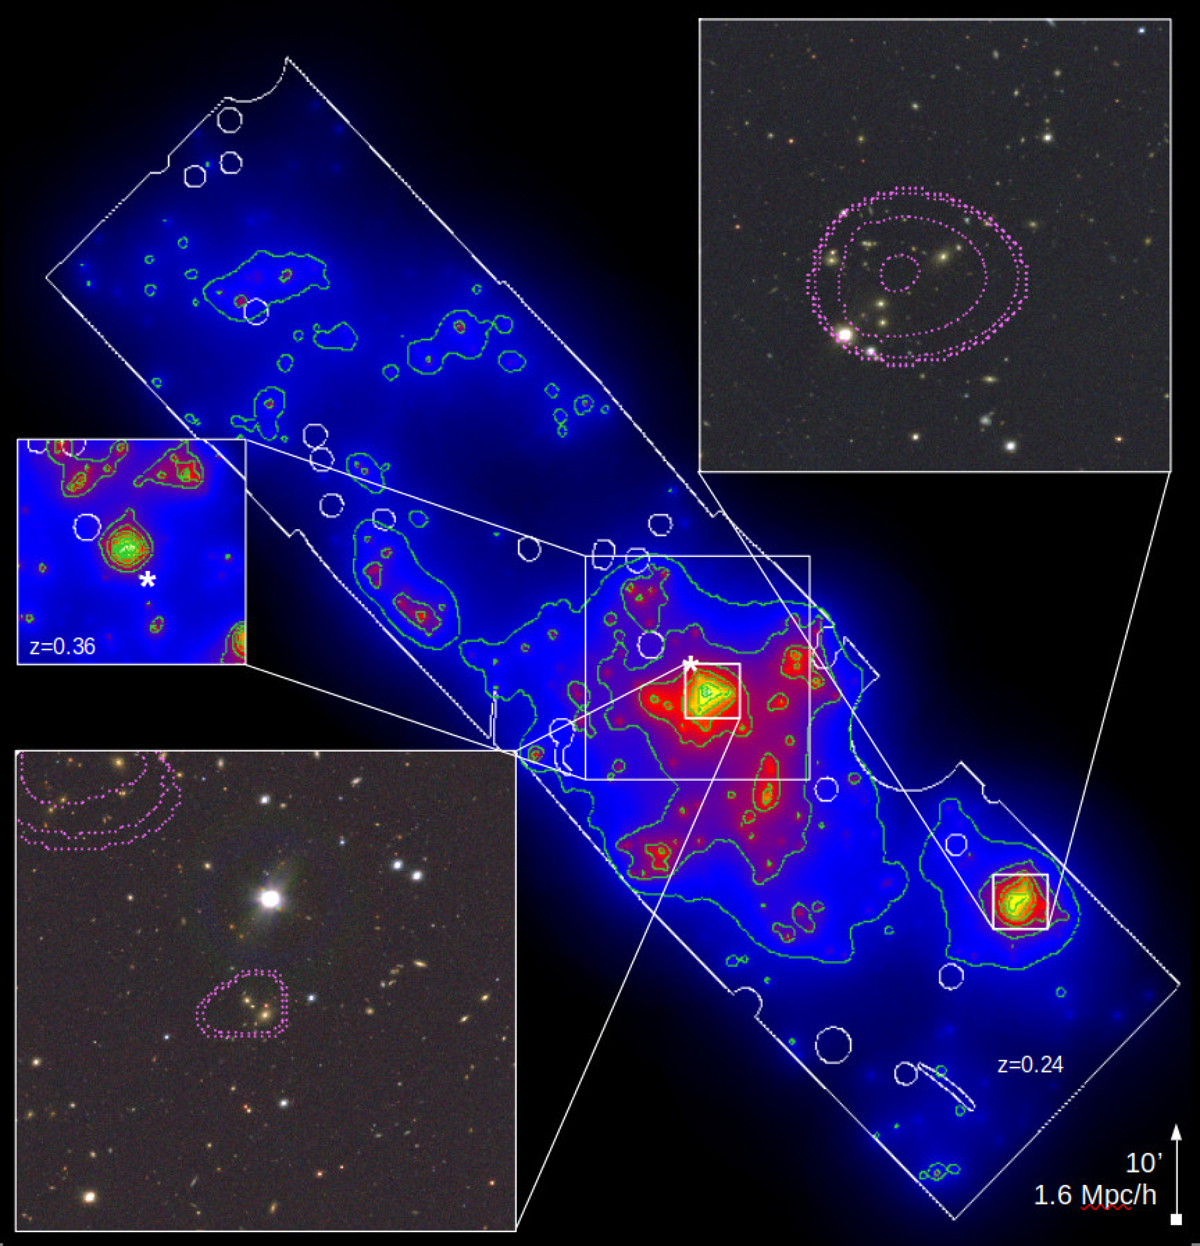
Illustration of the AMICO response amplitude for a redshift slice at z = 0.24. The overdensities highlighted by AMICO are clearly visible as strong enhancements over the background. The survey footprint and masked areas are indicated in white. The two boxes with the miniJPAS images show the two most significant detections at that redshift together with X-ray emission isocontours. The top left box shows the response of AMICO around the main central structure at z = 0.24 and at redshift z = 0.36, where another cluster is clearly visible. There is little cross-contamination between redshift slices. The cluster on the right side is a case of chance alignment between two structures (see left panel of Fig. 6). The asterisks in the figures indicate the position of the cluster visible in the other redshift slice and displaced nearly along the same line of sight.
Current usage metrics show cumulative count of Article Views (full-text article views including HTML views, PDF and ePub downloads, according to the available data) and Abstracts Views on Vision4Press platform.
Data correspond to usage on the plateform after 2015. The current usage metrics is available 48-96 hours after online publication and is updated daily on week days.
Initial download of the metrics may take a while.