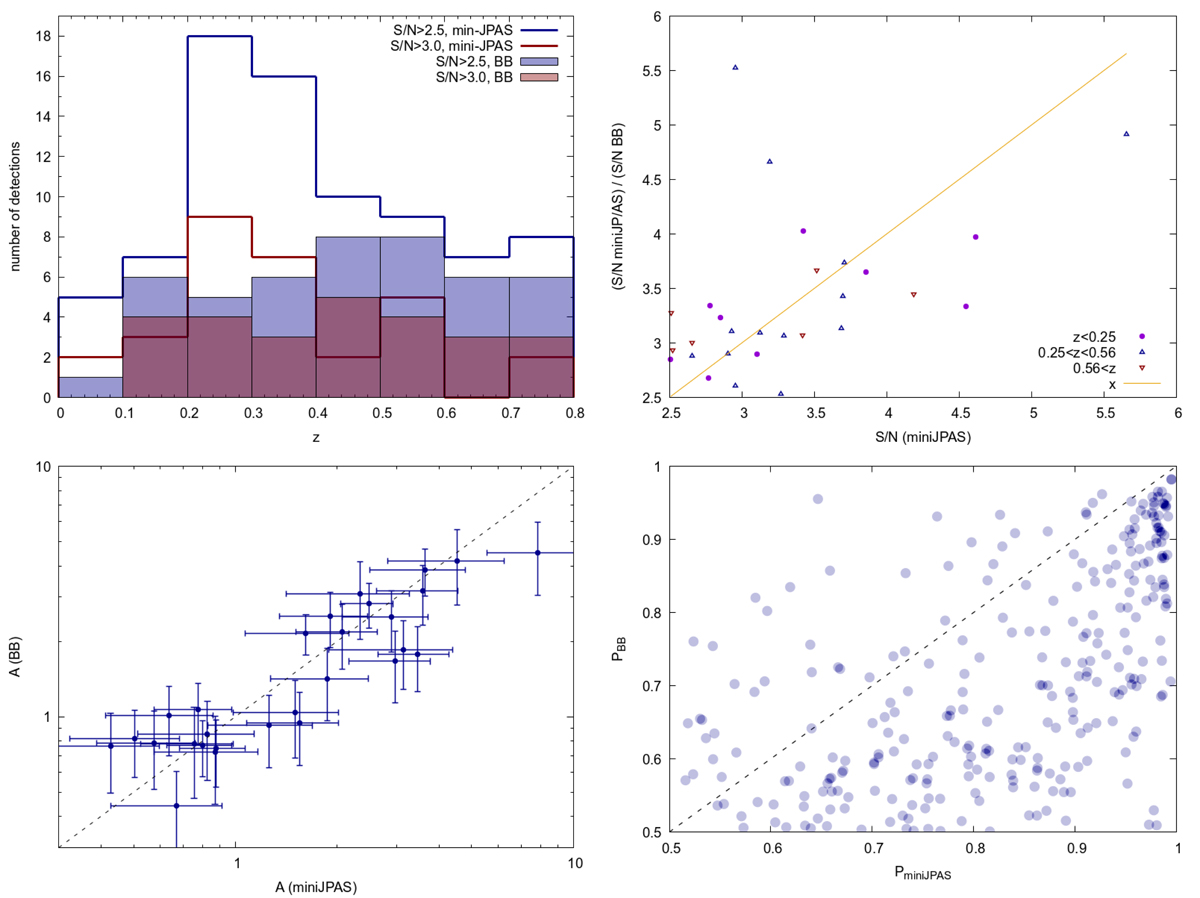
Fig. 12.
Download original image
Comparison between properties of the detections derived from the catalogue of galaxies with degraded photo-z, mimicking a typical photometric survey with redshift uncertainty σz = 0.03(1 + z) (broad-band, BB), and of the detections based on the original miniJPAS data exploiting the 56 J-PAS filters. Top left panel: redshift distribution of the detections. The solid boxes refer to the degraded broad-band data and the lines to the original dataset. The detections with S/N > 2.5 and S/N > 3 are in blue and red, respectively. Top right panel: signal-to-noise ratios. Bottom left panel: Amplitude A. Bottom right panel: probabilistic membership association of galaxies to clusters, as provided by AMICO.
Current usage metrics show cumulative count of Article Views (full-text article views including HTML views, PDF and ePub downloads, according to the available data) and Abstracts Views on Vision4Press platform.
Data correspond to usage on the plateform after 2015. The current usage metrics is available 48-96 hours after online publication and is updated daily on week days.
Initial download of the metrics may take a while.