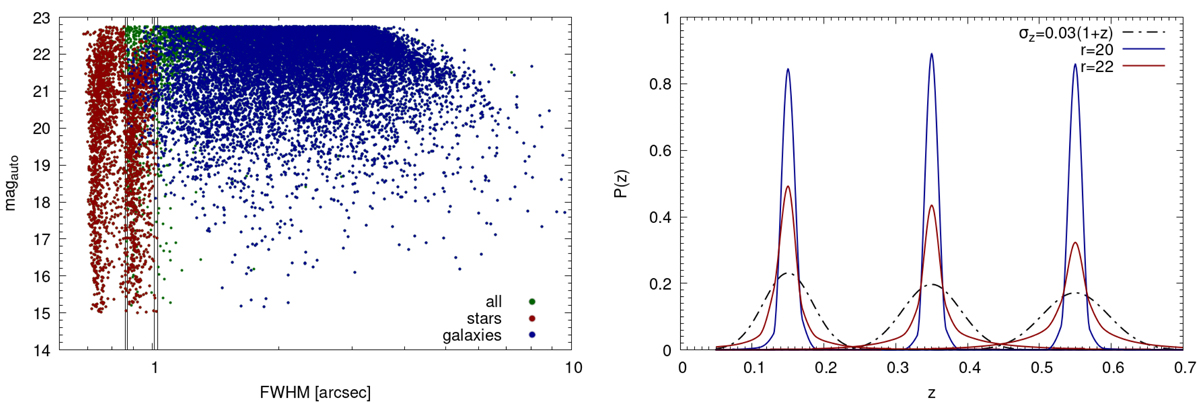
Fig. 1.
Download original image
Size and magnitude of all sources and photometric redshift of the input galaxies. Left panel: r-band magnitude vs FWHM of the galaxies detected in miniJPAS and used for the analysis (in blue). Shown are objects with a “stellarity” Bayesian probability of being stars higher than 50% (in red) and of being galaxies lower than 50% (in blue). All objects (in green) with a FWHM smaller than the PSF size of each individual pointing plus a tolerance of 0.11 arcsec (indicated by the vertical lines) were rejected regardless their classification. Right panel: average redshift probability distribution of galaxies as measured by AMICO with a peak P(z) located at three different redshifts and for two different magnitudes: r = 20 and r = 22 (in blue and red, respectively). This estimate is produced by AMICO through the input photo-zs and is used in the cluster model construction. The black dashed lines show the typical uncertainty of photo-zs based on broad-band photometry.
Current usage metrics show cumulative count of Article Views (full-text article views including HTML views, PDF and ePub downloads, according to the available data) and Abstracts Views on Vision4Press platform.
Data correspond to usage on the plateform after 2015. The current usage metrics is available 48-96 hours after online publication and is updated daily on week days.
Initial download of the metrics may take a while.