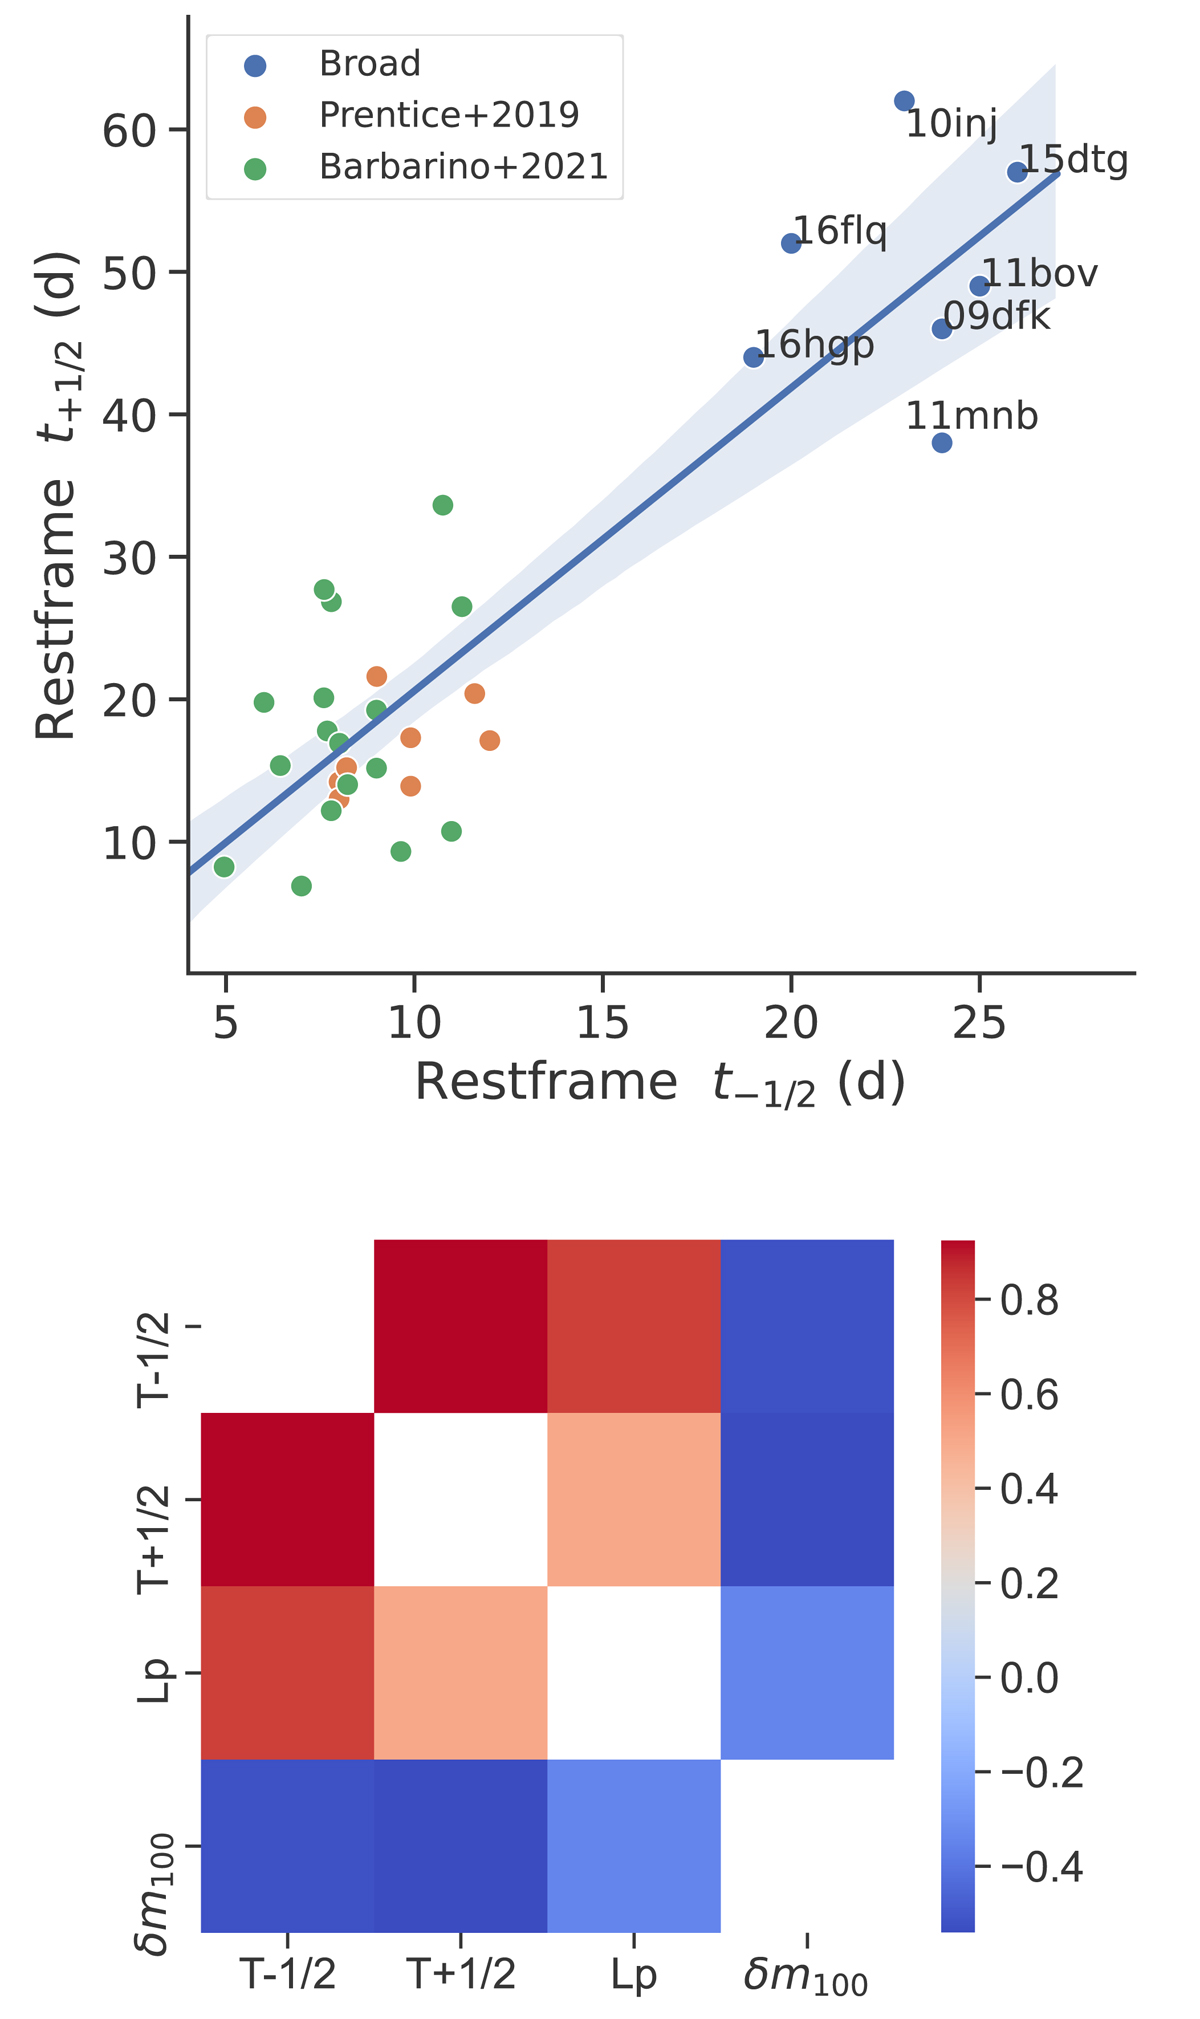
Fig. 8.
Download original image
Top: bolometric lightcurve properties of our broad sample compared to SE SNe from Prentice et al. (2019) and Barbarino et al. (2021). Bottom: a correlation heatmap between the broad sample and the literature SE SNe from Prentice et al. (2019) with darker shades representing a stronger correlation with red for a positive and blue for a negative correlation.
Current usage metrics show cumulative count of Article Views (full-text article views including HTML views, PDF and ePub downloads, according to the available data) and Abstracts Views on Vision4Press platform.
Data correspond to usage on the plateform after 2015. The current usage metrics is available 48-96 hours after online publication and is updated daily on week days.
Initial download of the metrics may take a while.