Fig. 9.
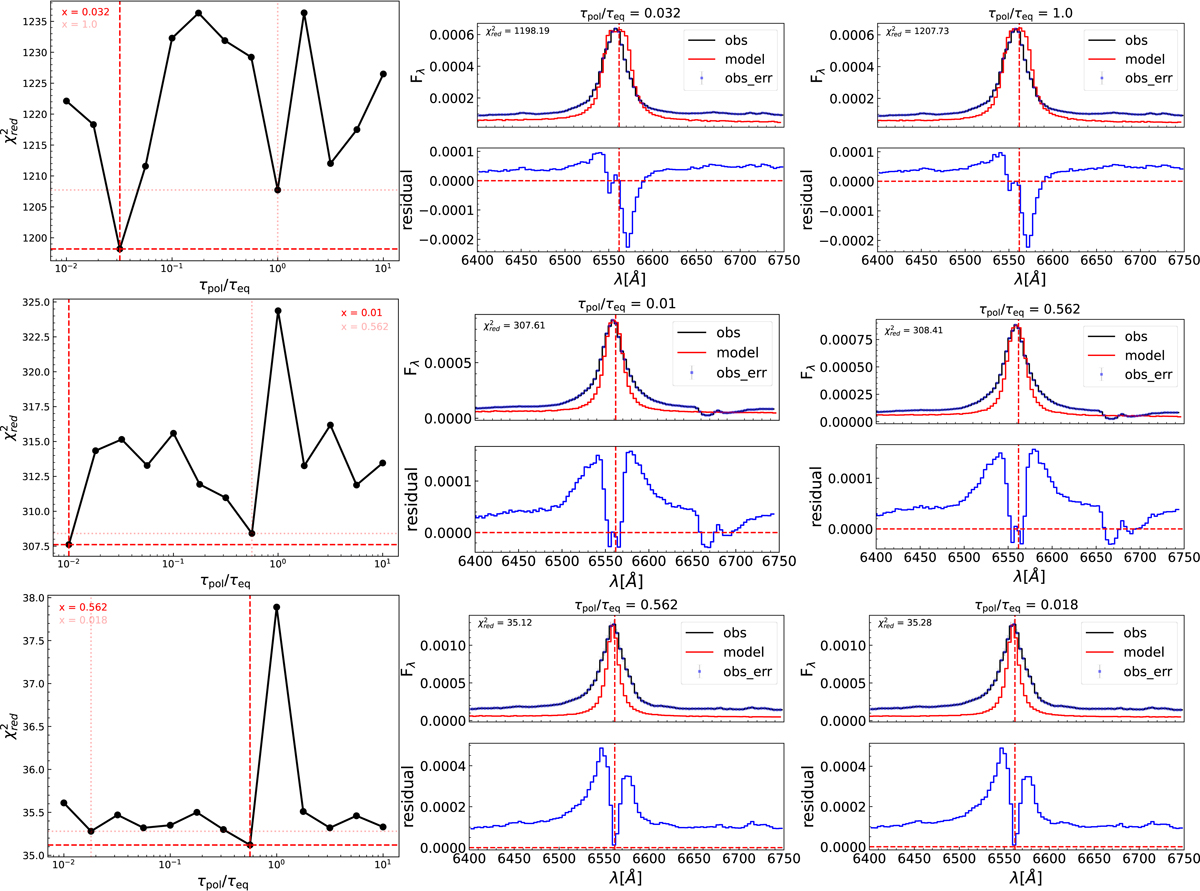
Download original image
Distribution of χ2 for a range of τpol/τeq for our three sources, Mrk 1044 (top rows), SDSS J080101 (middle rows), and IRAS 04416 (bottom rows). This range is the ratio of the optical depth in the polar region to the equatorial region. The location and the corresponding value of the ratio (τpol/τeq) of the minimum and second-to-minimum χ2 values are marked with dashed and dotted lines, respectively. Middle and right columns: fit for the total flux for each source corresponding to the minimum χ2 and the second-to-minimum χ2.
Current usage metrics show cumulative count of Article Views (full-text article views including HTML views, PDF and ePub downloads, according to the available data) and Abstracts Views on Vision4Press platform.
Data correspond to usage on the plateform after 2015. The current usage metrics is available 48-96 hours after online publication and is updated daily on week days.
Initial download of the metrics may take a while.