Fig. 3.
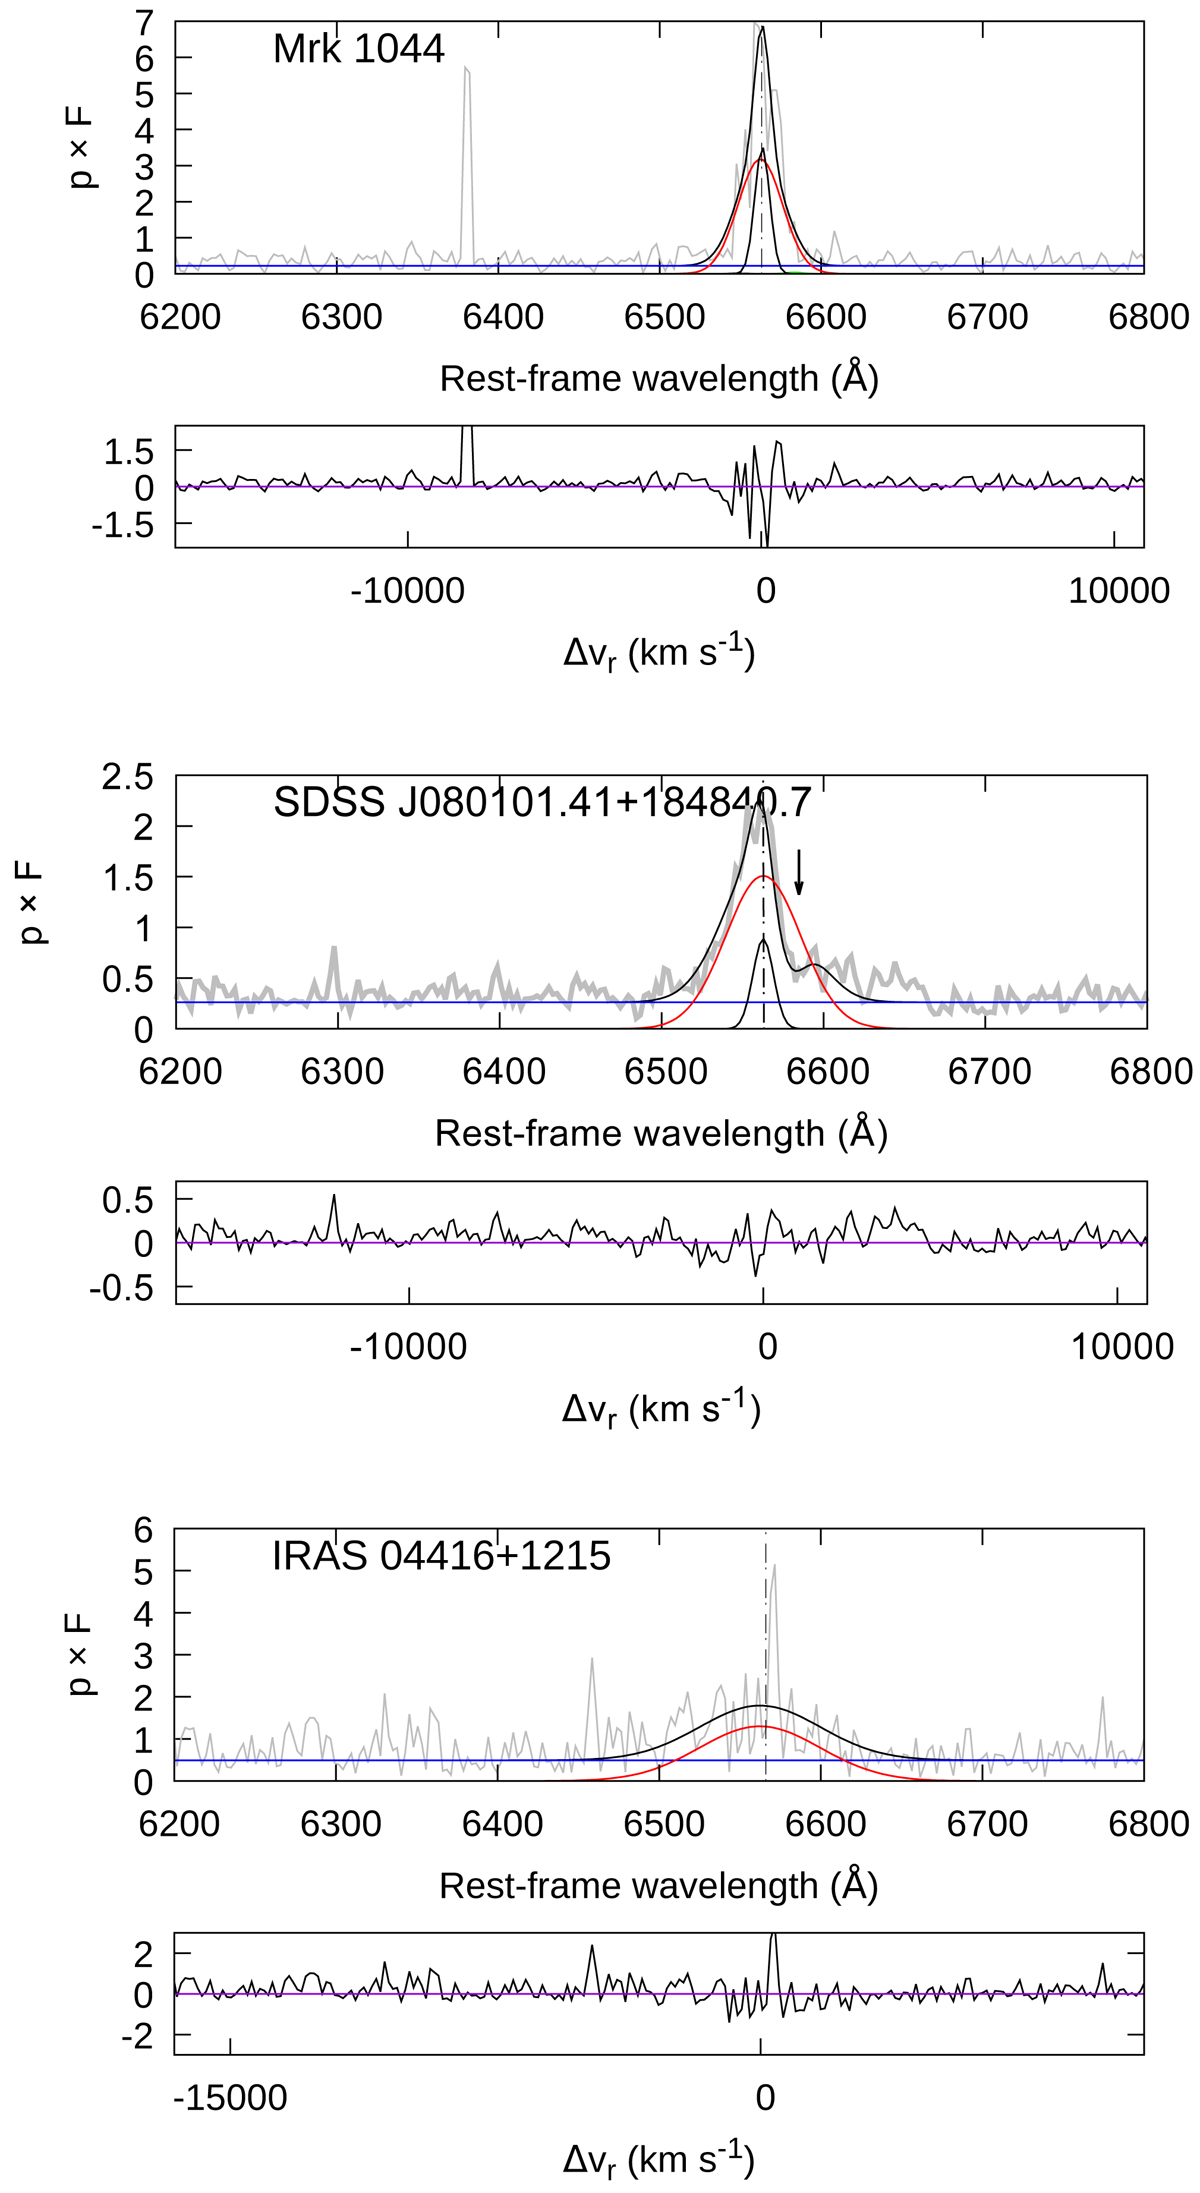
Download original image
Fitted Hα part from the polarized spectrum obtained with FORS/VLT. The data are marked in gray, and the model is marked in black. For each fit, we considered two components of Hα: a BC (red) and an NC (black). The blue line corresponds to the power-law continuum. The lower panels of each plot correspond to the residuals, in radial velocity in units of km s−1. With an arrow, we mark the presence of an “absorption” in the fit of SDSS J080101. The “absorption” is meant to account for the low S/N of the data and to ease the fit of a symmetric Gaussian constrained by the blue side of the polarized flux profile.
Current usage metrics show cumulative count of Article Views (full-text article views including HTML views, PDF and ePub downloads, according to the available data) and Abstracts Views on Vision4Press platform.
Data correspond to usage on the plateform after 2015. The current usage metrics is available 48-96 hours after online publication and is updated daily on week days.
Initial download of the metrics may take a while.